

Answered step by step
Verified Expert Solution
Question
1 Approved Answer
Construct a frequency bar graph for the data. Round your answers to two decimal places. 0.40 0.39 0.35 0.30 0.27 0.25 Relative Frequency 0.21 0.20
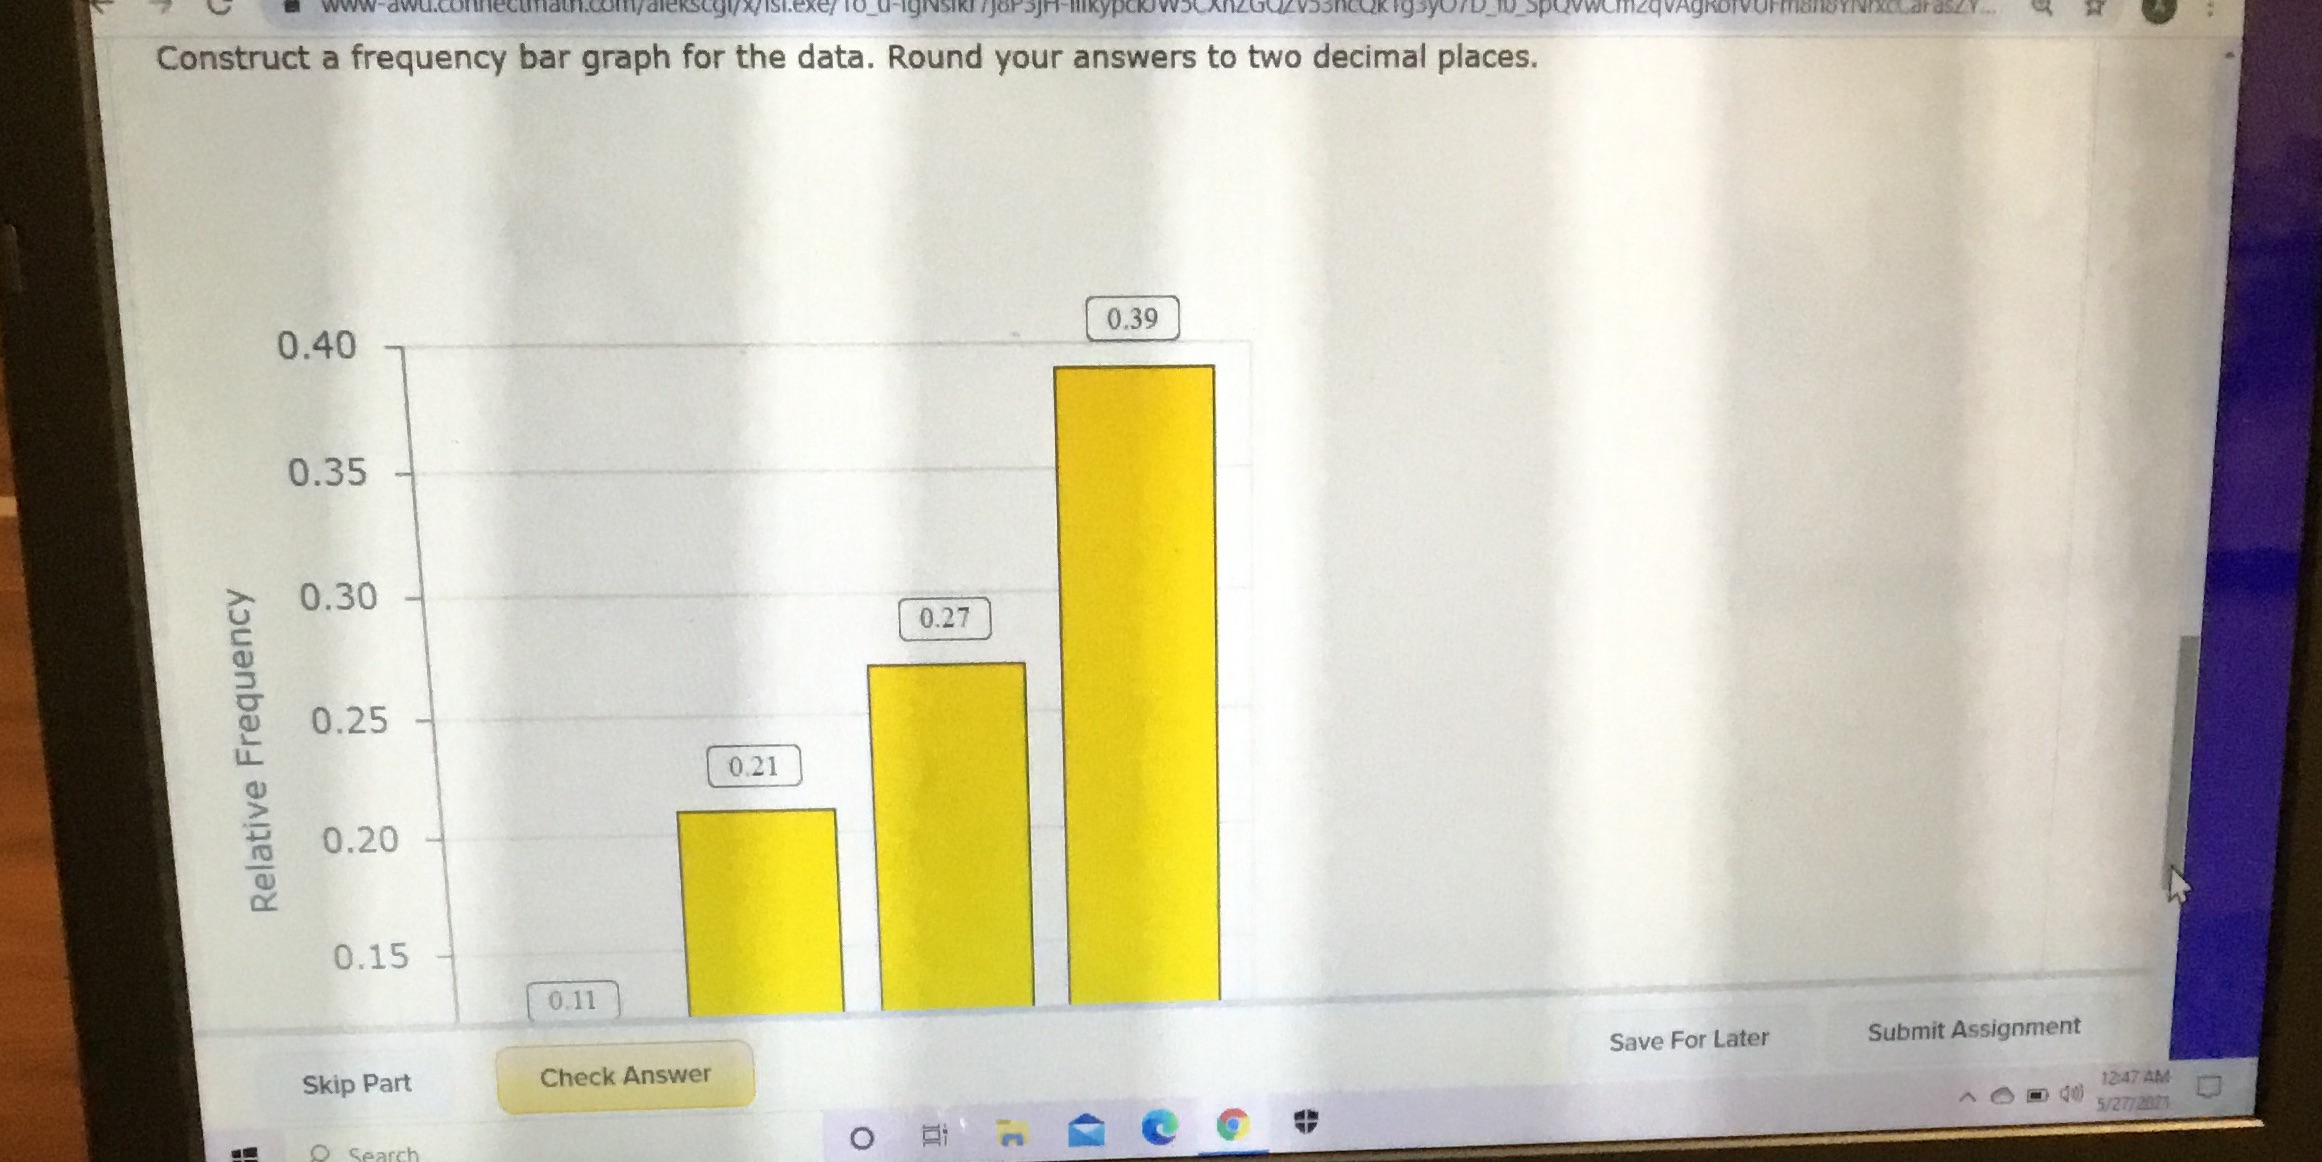 Construct a frequency bar graph for the data. Round your answers to two decimal places. 0.40 0.39 0.35 0.30 0.27 0.25 Relative Frequency 0.21 0.20 0.15 0.11 Save For Later Submit Assignment Skip Part Check Answer 12:47 AM 5/2772023
Step by Step Solution
There are 3 Steps involved in it
Step: 1

Get Instant Access to Expert-Tailored Solutions
See step-by-step solutions with expert insights and AI powered tools for academic success
Step: 2

Step: 3
Ace Your Homework with AI
Get the answers you need in no time with our AI-driven, step-by-step assistance
Get Started
Calculus An Applied Approach
Authors: Ron Larson, Dennis J McKenzie, Larson/Edwards, Bruce H Edwards
7th Edition