Answered step by step
Verified Expert Solution
Question
1 Approved Answer
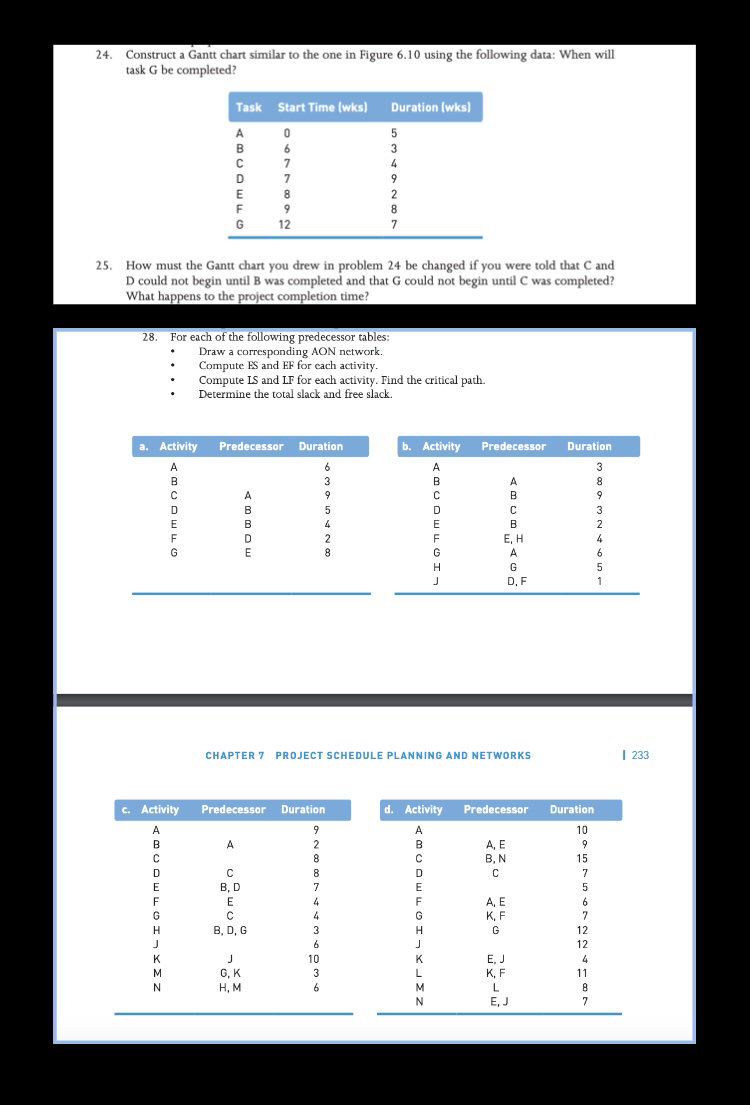
Construct a Gantt chart similar to the one in Figure 6 . 1 0 using the following data: When will task G be completed? How
Construct a Gantt chart similar to the one in Figure using the following data: When will
task be completed?
How must the Gantt chart you drew in problem be changed if you were told that and
D could not begin until B was completed and that G could not begin until C was completed?
What happens to the project completion time?
For each of the following predecessor tables:
Draw a corresponding AON network.
Compute ES and EF for each activity.
Compute LS and LF for each activity. Find the critical path.
Determine the total slack and free slack.

Step by Step Solution
There are 3 Steps involved in it
Step: 1

Get Instant Access to Expert-Tailored Solutions
See step-by-step solutions with expert insights and AI powered tools for academic success
Step: 2

Step: 3

Ace Your Homework with AI
Get the answers you need in no time with our AI-driven, step-by-step assistance
Get Started


