Answered step by step
Verified Expert Solution
Question
1 Approved Answer
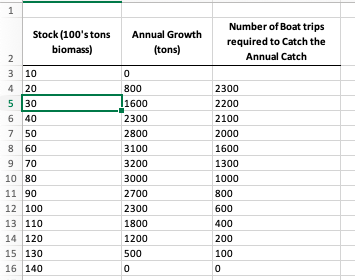
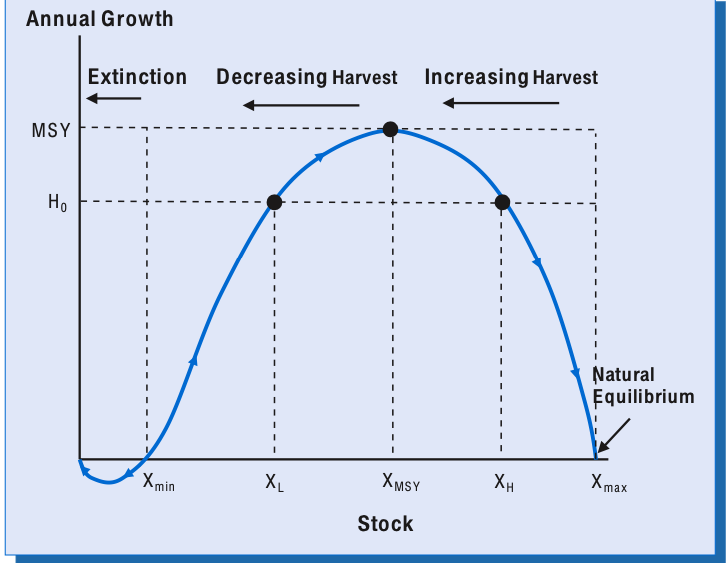
Construct a graph showing the relationship between stock and growth, similar to the figure shown. Identify on your graph the stock levels that correspond to


Construct a graph showing the relationship between stock and growth, similar to the figure shown. Identify on your graph the stock levels that correspond to the maximum sustainable yield, and the stable and unstable equilibrium stock levels for this fish population in a natural state.
1 Annual Growth (tons) Number of Boat trips required to catch the Annual Catch Stock (100's tons biomass) 2 3 10 4 20 5 30 6 40 750 8 60 9 70 10 80 11 90 12 100 13 110 14 120 15 130 16 140 0 800 11600 2300 2800 3100 3200 3000 2700 2300 1800 1200 500 0 2300 2200 2100 2000 1600 1300 1000 800 600 400 200 100 0 Annual Growth Extinction Decreasing Harvest Increasing Harvest MSY Natural Equilibrium X min XL XMSY XH Xmax Stock 1 Annual Growth (tons) Number of Boat trips required to catch the Annual Catch Stock (100's tons biomass) 2 3 10 4 20 5 30 6 40 750 8 60 9 70 10 80 11 90 12 100 13 110 14 120 15 130 16 140 0 800 11600 2300 2800 3100 3200 3000 2700 2300 1800 1200 500 0 2300 2200 2100 2000 1600 1300 1000 800 600 400 200 100 0 Annual Growth Extinction Decreasing Harvest Increasing Harvest MSY Natural Equilibrium X min XL XMSY XH Xmax StockStep by Step Solution
There are 3 Steps involved in it
Step: 1

Get Instant Access to Expert-Tailored Solutions
See step-by-step solutions with expert insights and AI powered tools for academic success
Step: 2

Step: 3

Ace Your Homework with AI
Get the answers you need in no time with our AI-driven, step-by-step assistance
Get Started


