Answered step by step
Verified Expert Solution
Question
1 Approved Answer
Construct a scatter plot relating the unemployment rate and the job-opening (vacancy) rate for each State in the U.S. (in the figure each observation

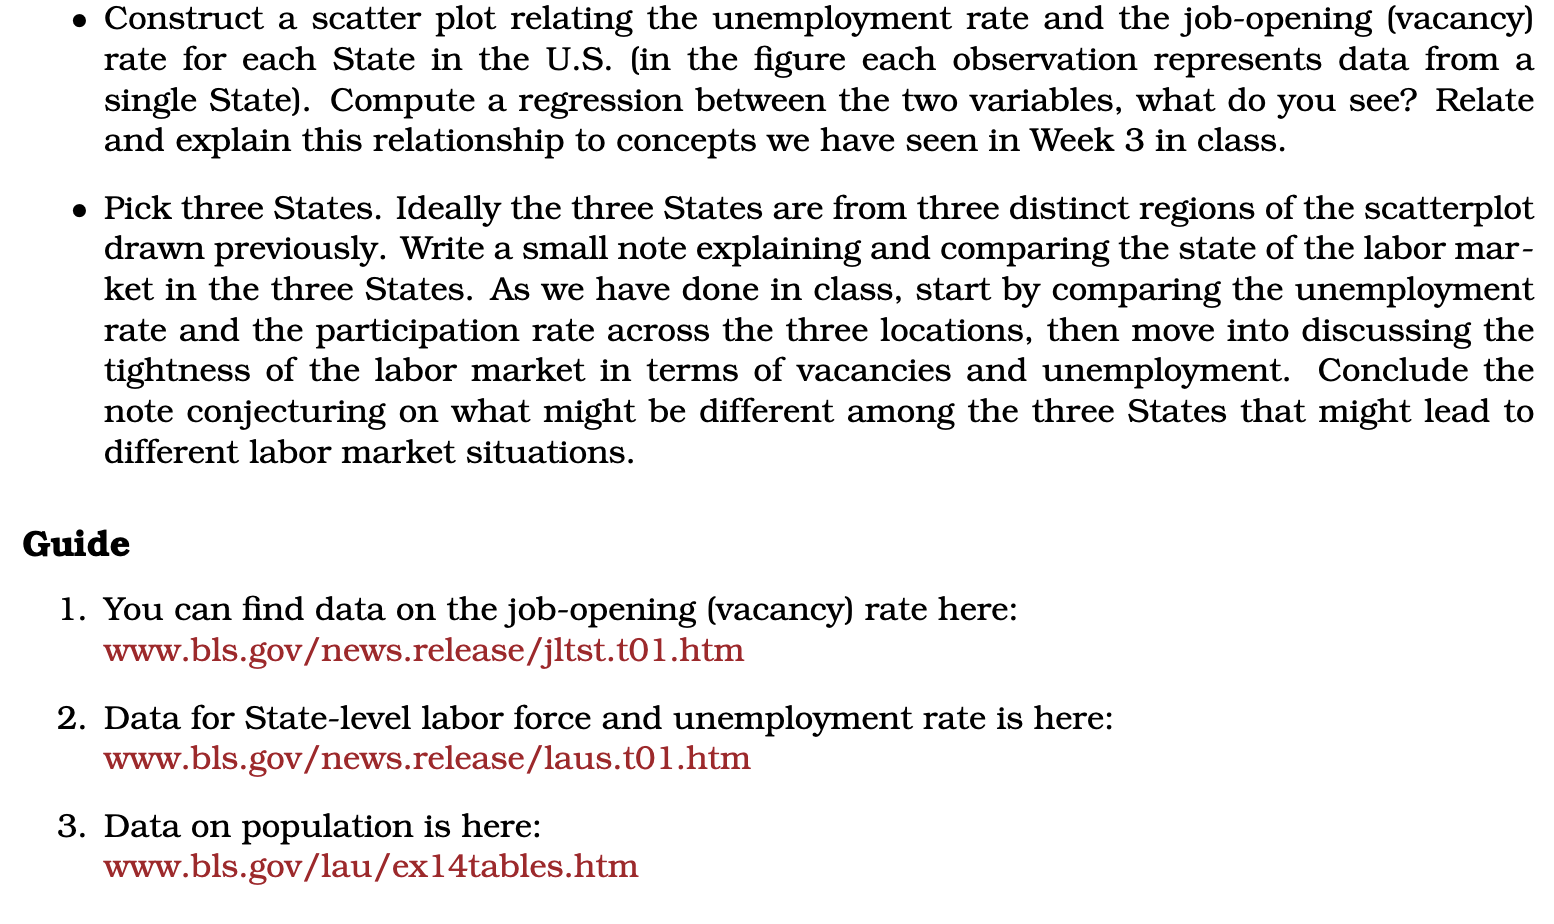
Construct a scatter plot relating the unemployment rate and the job-opening (vacancy) rate for each State in the U.S. (in the figure each observation represents data from a single State). Compute a regression between the two variables, what do you see? Relate and explain this relationship to concepts we have seen in Week 3 in class. Pick three States. Ideally the three States are from three distinct regions of the scatterplot drawn previously. Write a small note explaining and comparing the state of the labor mar- ket in the three States. As we have done in class, start by comparing the unemployment rate and the participation rate across the three locations, then move into discussing the tightness of the labor market in terms of vacancies and unemployment. Conclude the note conjecturing on what might be different among the three States that might lead to different labor market situations. Guide 1. You can find data on the job-opening (vacancy) rate here: www.bls.gov/news.release/jltst.t01.htm 2. Data for State-level labor force and unemployment rate is here: www.bls.gov/news.release/laus.t01.htm 3. Data on population is here: www.bls.gov/lau/ex14tables.htm
Step by Step Solution
There are 3 Steps involved in it
Step: 1
Scatter Plot and Regression Analysis Using the data from the Bureau of Labor Statistics I constructed a scatter plot relating the unemployment rate an...
Get Instant Access to Expert-Tailored Solutions
See step-by-step solutions with expert insights and AI powered tools for academic success
Step: 2

Step: 3

Ace Your Homework with AI
Get the answers you need in no time with our AI-driven, step-by-step assistance
Get Started


