Answered step by step
Verified Expert Solution
Question
1 Approved Answer
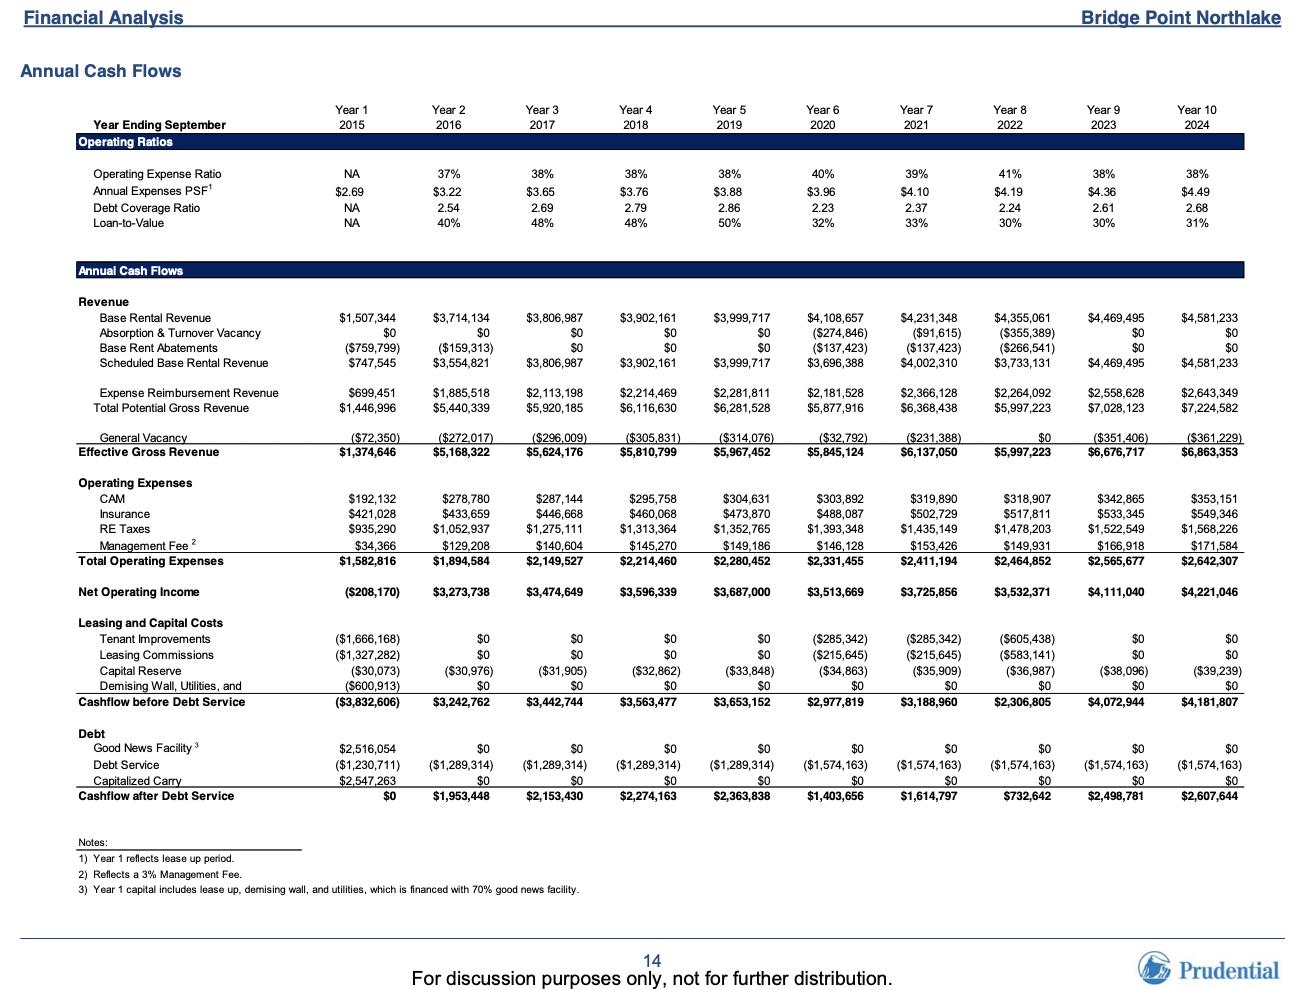
Construct a simple Excel spreadsheet using the Cash Flow Before Debt Service and Net Operating Income numbers in the photo below. Please ignore the debt
Construct a simple Excel spreadsheet using the Cash Flow Before Debt Service and Net Operating Income numbers in the photo below. Please ignore the debt service numbers, as you will create your own debt service.
- Assume you are buying the building at the beginning of year 4 for $74,000,000. Based on that purchase price, what are the annual cash-on-cost returns, by year? What is the unleveraged IRR on that purchase through 2024 (assume a 5.5% residual cap rate on 2024 Net operating income at the end of 2024)?
- Now, finance 50% of the purchase price with interest only financing (fixed at 3.50% annually) for the term of your ownership. What is the resulting leveraged IRR for your equity? What is the DSCR (debt service coverage ratio) on the first mortgage debt, by year?
- Next, in addition to the first mortgage financing, add mezzanine financing on top of that from 50% to 75% of the purchase price (also interest only, at a 6.00% annual rate). What is the leveraged equity IRR now? What is the DSCR on the first mortgage and mezzanine debt, by year?
Other questions:
- What is the blended cost of debt for the purchaser using both the first mortgage and mezzanine debt as described above?
- What issues do you think the first mortgage and mezzanine lenders might be struggling with as they consider lending on your deal?
- What level of debt is the most comfortable for you over the projected ownership term? Why?

Financial Analysis Annual Cash Flows Year Ending September Operating Ratios Operating Expense Ratio Annual Expenses PSF Debt Coverage Ratio Loan-to-Value Annual Cash Flows Revenue Base Rental Revenue Absorption & Turnover Vacancy Base Rent Abatements Scheduled Base Rental Revenue Expense Reimbursement Revenue Total Potential Gross Revenue General Vacancy Effective Gross Revenue Operating Expenses CAM Insurance RE Taxes Management Fee Total Operating Expenses Net Operating Income Leasing and Capital Costs Tenant Improvements Leasing Commissions. Capital Reserve Demising Wall, Utilities, and Cashflow before Debt Service Debt Good News Facility 3 Debt Service Capitalized Carry Cashflow after Debt Service Year 1 2015 $2.69 NA $1,507,344 $0 ($759,799) $747,545 $699,451 $1,446,996 ($72,350) $1,374,646 $192,132 $421,028 $935,290 $34,366 $1,582,816 ($208,170) ($1,666,168) ($1,327,282) ($30,073) ($600,913) ($3,832,606) Year 2 2016 37% $3.22 2.54 40% $3,714,134 $0 ($159,313) $3,554,821 $1,885,518 $5,440,339 ($272,017) $5,168,322 $278,780 $433,659 $1,052,937 $129,208 $1,894,584 $3,273,738 $0 $0 ($30,976) $0 $3,242,762 Year 3 2017 38% $3.65 2.69 48% $3,806,987 $0 $0 $3,806,987 $2,113,198 $5,920,185 ($296,009) $5,624,176 $287,144 $446,668 $1,275,111 $140,604 $2,149,527 $3,474,649 $0 $0 ($31,905) $0 $3,442,744 Year 4 2018 Notes: 1) Year 1 reflects lease up period. 2) Reflects a 3% Management Fee. 3) Year 1 capital includes lease up, demising wall, and utilities, which is financed with 70% good news facility. 38% $3.76 2.79 48% $3,902,161 $0 $0 $3,902,161 $2,214,469 $6,116,630 ($305,831) $5,810,799 $295,758 $460,068 $1,313,364 $145,270 $2,214,460 $3,596,339 $0 $0 ($32,862) $0 $3,563,477 Year 5 2019 38% $3.88 2.86 50% $3,999,717 $0 $0 $3,999,717 $2,281,811 $6,281,528 ($314.076) $5,967,452 $304,631 $473,870 $1,352,765 $149,186 $2,280,452 $3,687,000 SO $0 ($33,848) $0 $3,653,152 $0 $0 $2,516,054 $0 $0 ($1,230,711) ($1,289,314) ($1,289,314) ($1,289,314) ($1,289,314) $2,547,263 $0 $0 $0 $0 $2,153,430 $2,274,163 $2,363,838 $0 $1,953,448 Year 6 2020 40% $3.96 2.23 32% $4,108,657 ($274,846) ($137,423) $3,696,388 $2,181,528 $5,877,916 ($32,792) $5,845,124 $303,892 $488,087 $1,393,348 $146,128 $2,331,455 $3,513,669 ($285,342) ($215,645) ($34,863) $0 $2,977,819 $0 ($1,574,163) $0 $1,403,656 14 For discussion purposes only, not for further distribution. Year 7 2021 39% $4.10 2.37 33% $4,231,348 ($91,615) ($137,423) $4,002,310 $2,366,128 $6,368,438 ($231,388) $6,137,050 $319,890 $502,729 $1,435,149 $153,426 $2,411,194 $3,725,856 ($285,342) ($215,645) ($35,909) $0 $3,188,960 Year 8 2022 41% $4.19 2.24 30% $4,355,061 ($355,389) ($266,541) $3,733,131 $2,264,092 $5,997,223 $0 $5,997,223 $318,907 $517,811 $1,478,203 $149,931 $2,464,852 $3,532,371 ($605,438) ($583,141) ($36,987) $0 $2,306,805 Bridge Point Northlake Year 9 2023 38% $4.36 2.61 30% $4,469,495 $0 $0 $4,469,495 $2,558,628 $7,028,123 ($351,406) $6,676,717 $342,865 $533,345 $1,522,549 $166,918 $2,565,677 $4,111,040 $0 $0 ($38,096) $0 $4,072,944 $0 $0 $0 ($1,574,163) ($1,574,163) ($1,574,163) $1,614,797 $0 $0 $732,642 $0 $2,498,781 Year 10 2024 38% $4.49 2.68 31% $4,581,233 $0 $0 $4,581,233 $2,643,349 $7,224,582 ($361,229) $6,863,353 $353,151 $549,346 $1,568,226 $171,584 $2,642,307 $4,221,046 $0 $0 ($39,239) $0 $4,181,807 $0 ($1,574,163) $0 $2,607,644 Prudential
Step by Step Solution
★★★★★
3.32 Rating (155 Votes )
There are 3 Steps involved in it
Step: 1

Get Instant Access to Expert-Tailored Solutions
See step-by-step solutions with expert insights and AI powered tools for academic success
Step: 2

Step: 3

Ace Your Homework with AI
Get the answers you need in no time with our AI-driven, step-by-step assistance
Get Started


