

Question
Construct a Statement of Cashflow using indirect method! Additional data for the period January 1, Year 2, through December 31, Year 2, are: 1. Sales
 Construct a Statement of Cashflow using indirect method!
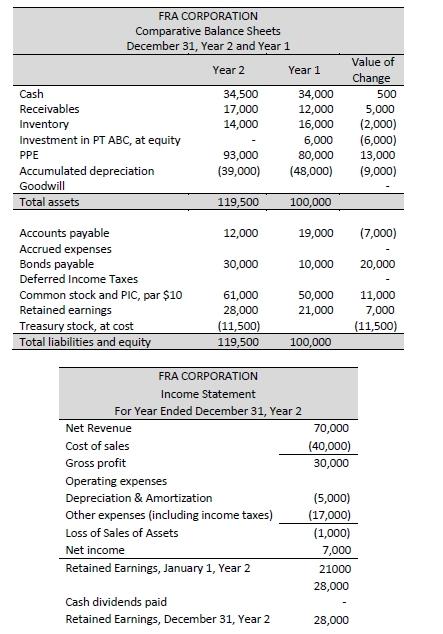
Additional data for the period January 1, Year 2, through December 31, Year 2, are: 1. Sales on account, $70,000. 2. Purchases on account, $40,000. 3. Depreciation, $5,000. 4. Expenses paid in cash, $18,000 (including $4,000 of interest and $6,000 in taxes). 5. Decrease in inventory, $2,000. 6. Sales of fixed assets for $6,000 cash; cost $21,000 and two-thirds depreciated (loss or gain is included in income). 7. Purchase of fixed assets for cash, $4,000. 8. Fixed assets are exchanged for bonds payable of $30,000. 9. Sale of investments for $9,000 cash. 10. Purchase of treasury stock for cash, $11,500. 11. Retire bonds payable by issuing common stock, $10,000. 12. Collections on accounts receivable, $65,000. 13. Sold unissued common stock for cash, $1,000
FRA CORPORATION Comparative Balance Sheets December 31, Year 2 and Year 1 Year 2 Year 1 Cash 34,500 34,000 Receivables 17,000 12,000 Inventory 14,000 16,000 Investment in PT ABC, at equity 6,000 PPE 93,000 80,000 Accumulated depreciation (39,000) (48,000) Goodwill Total assets 119,500 100,000 Value of Change 500 5,000 (2,000) (6,000) 13,000 (9,000) 12,000 19,000 (7,000) 30,000 10,000 20,000 Accounts payable Accrued expenses Bonds payable Deferred Income Taxes Common stock and PIC, par $10 Retained earnings Treasury stock, at cost Total liabilities and equity 50,000 21,000 61,000 28,000 (11,500) 119,500 11,000 7,000 (11,500) 100,000 FRA CORPORATION Income Statement For Year Ended December 31, Year 2 Net Revenue 70,000 Cost of sales (40,000) Gross profit 30,000 Operating expenses Depreciation & Amortization (5,000) Other expenses (including income taxes) (17,000) Loss of Sales of Assets (1,000) Net income 7,000 Retained Earnings, January 1, Year 2 21000 28,000 Cash dividends paid Retained Earnings, December 31, Year 2 28,000 FRA CORPORATION Comparative Balance Sheets December 31, Year 2 and Year 1 Year 2 Year 1 Cash 34,500 34,000 Receivables 17,000 12,000 Inventory 14,000 16,000 Investment in PT ABC, at equity 6,000 PPE 93,000 80,000 Accumulated depreciation (39,000) (48,000) Goodwill Total assets 119,500 100,000 Value of Change 500 5,000 (2,000) (6,000) 13,000 (9,000) 12,000 19,000 (7,000) 30,000 10,000 20,000 Accounts payable Accrued expenses Bonds payable Deferred Income Taxes Common stock and PIC, par $10 Retained earnings Treasury stock, at cost Total liabilities and equity 50,000 21,000 61,000 28,000 (11,500) 119,500 11,000 7,000 (11,500) 100,000 FRA CORPORATION Income Statement For Year Ended December 31, Year 2 Net Revenue 70,000 Cost of sales (40,000) Gross profit 30,000 Operating expenses Depreciation & Amortization (5,000) Other expenses (including income taxes) (17,000) Loss of Sales of Assets (1,000) Net income 7,000 Retained Earnings, January 1, Year 2 21000 28,000 Cash dividends paid Retained Earnings, December 31, Year 2 28,000Step by Step Solution
There are 3 Steps involved in it
Step: 1

Get Instant Access to Expert-Tailored Solutions
See step-by-step solutions with expert insights and AI powered tools for academic success
Step: 2

Step: 3
Ace Your Homework with AI
Get the answers you need in no time with our AI-driven, step-by-step assistance
Get Started
Finance And Economics Discussion Series Expectations Learning And The Costs Of Disinflation Experiments Using The FRB US Model
Authors: United States Federal Reserve Board, Antulio Bomfim
1st Edition
1288721609, 9781288721603