Question
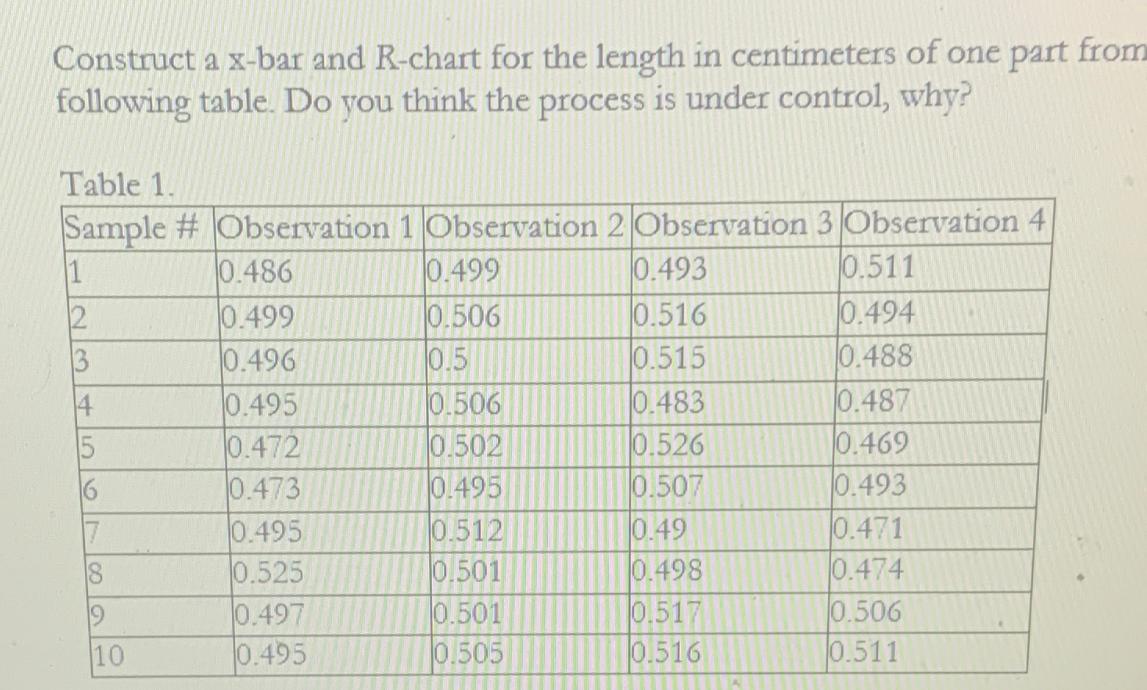
Construct a x-bar and R-chart for the length in centimeters of one part from following table. Do you think the process is under control,

Construct a x-bar and R-chart for the length in centimeters of one part from following table. Do you think the process is under control, why? Table 1. Sample # Observation 1 Observation 2 Observation 3 Observation 4 1 0.486 0.499 0.493 0.511 2 0.499 0.506 0.516 0.494 0.496 0.5 0.515 0.488 4 0.495 0.506 0.483 0.487 0.472 0.502 0.526 0.469 16 0.473 0.495 0.507 0.493 0.495 0.512 0.49 0.471 0.525 0.501 0.498 0.474 9 0.497 0.501 0.517 0.506 10 0.495 0.505 0.516 0.511
Step by Step Solution
There are 3 Steps involved in it
Step: 1

Get Instant Access to Expert-Tailored Solutions
See step-by-step solutions with expert insights and AI powered tools for academic success
Step: 2

Step: 3

Ace Your Homework with AI
Get the answers you need in no time with our AI-driven, step-by-step assistance
Get StartedRecommended Textbook for
Linear Algebra
Authors: Jim Hefferon
1st Edition
978-0982406212, 0982406215
Students also viewed these Accounting questions
Question
Answered: 1 week ago
Question
Answered: 1 week ago
Question
Answered: 1 week ago
Question
Answered: 1 week ago
Question
Answered: 1 week ago
Question
Answered: 1 week ago
Question
Answered: 1 week ago
Question
Answered: 1 week ago
Question
Answered: 1 week ago
Question
Answered: 1 week ago
Question
Answered: 1 week ago
Question
Answered: 1 week ago
Question
Answered: 1 week ago
Question
Answered: 1 week ago
Question
Answered: 1 week ago
Question
Answered: 1 week ago
Question
Answered: 1 week ago
Question
Answered: 1 week ago
Question
Answered: 1 week ago
Question
Answered: 1 week ago
View Answer in SolutionInn App


