

Answered step by step
Verified Expert Solution
Question
1 Approved Answer
Construct Mean and Range chart from the following data. Assume constant values A2 = 1.02, D3 = 0, D4 = 2.57 Is the process
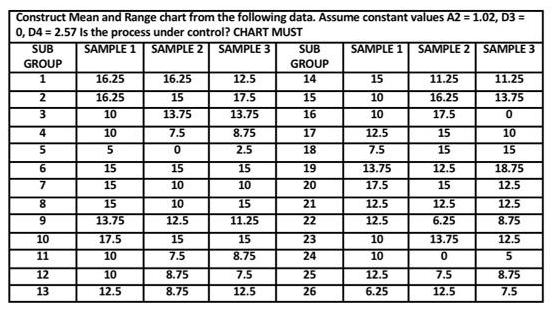
Construct Mean and Range chart from the following data. Assume constant values A2 = 1.02, D3 = 0, D4 = 2.57 Is the process under control? CHART MUST SUB SAMPLE 1 SAMPLE 2 SAMPLE 3 GROUP 1 2 3 4 5 6 7 8 9 10 11 12 13 16.25 16.25 10 10 5 15 15 15 13.75 17.5 10 10 12.5 16.25 15 13.75 7.5 0 15 10 10 12.5 15 7.5 8.75 8.75 12.5 17.5 13.75 8.75 2.5 15 10 15 11.25 15 8.75 7.5 12.5 SUB GROUP 14 15 16 17 18 19 20 21 22 23 24 25 26 SAMPLE 1 SAMPLE 2 SAMPLE 3 15 10 10 12.5 7.5 13.75 17.5 12.5 12.5 10 10 12.5 6.25 11.25 16.25 17.5 15 15 12.5 15 12.5 6.25 13.75 0 7.5 12.5 11.25 13.75 0 10 15 18.75 12.5 12.5 8.75 12.5 5 8.75 7.5
Step by Step Solution
★★★★★
3.38 Rating (151 Votes )
There are 3 Steps involved in it
Step: 1
Group subgroup X 2 3 55 5 5 totoo O M 4 I I C 10 12 13 14 1...
Get Instant Access to Expert-Tailored Solutions
See step-by-step solutions with expert insights and AI powered tools for academic success
Step: 2

Step: 3
Ace Your Homework with AI
Get the answers you need in no time with our AI-driven, step-by-step assistance
Get Started
Business Statistics For Contemporary Decision Making
Authors: Black Ken
8th Edition
978-1118494769, 1118800842, 1118494768, 9781118800843, 978-1118749647