Question: Constructing a Semi-Empirical Model for Vehicle Fuel Efficiency In this homework you will use ideas about thermal energy generation from the tutorial to construct a
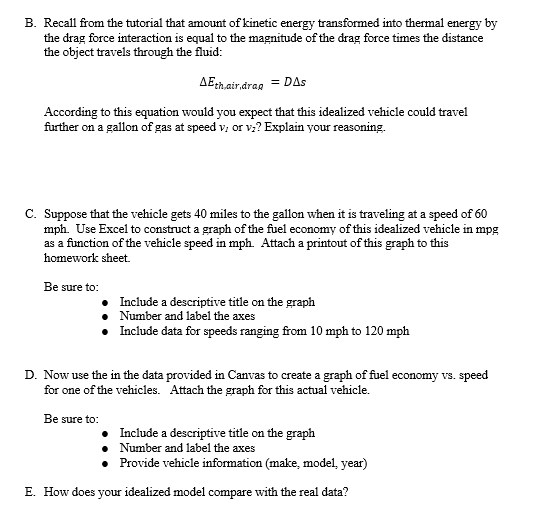
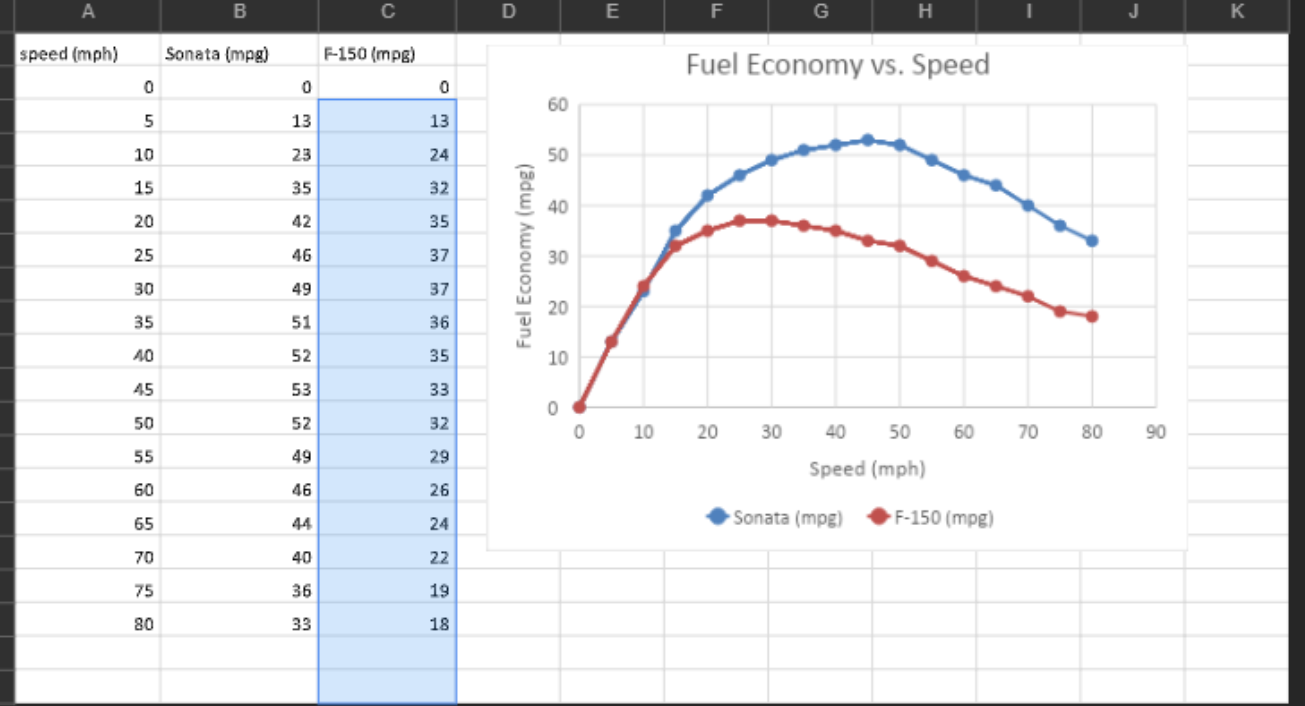
Constructing a Semi-Empirical Model for Vehicle Fuel Efficiency In this homework you will use ideas about thermal energy generation from the tutorial to construct a model for vehicle miles per gallon vs. speed for a real-world vehicle. The model that you construct will be semi-empirical meaning that it will be partly based on theoretical ideas and partly based on data for an actual vehicle. I. Air Drag Car Model In a real vehicle, not all the chemical energy in the gasoline is transformed into kinetic energy of the moving car. We are going to begin by considering an idealized model for a car in which all the chemical energy released in the burning of fuel is used to propel the vehicle forward. Further, we will assume that the only force opposing the vehicle's forward motion is the drag force on the vehicle by the air. In this idealized model the increase in thermal energy associated with air drag is balance by the decrease in chemical energy in the gasoline. AEthair,drag + Echfuel = 0 Finally, we will use the common, "quadratic model for drag was described in the tutorial: DE CAv2 1 where: p is the density of the fluid through which the object is traveling, C is the drag coefficient which depends on the shape of the object, A is the cross-sectional area of the object, and vis the speed at which the object is moving through the fluid. In this analysis we will consider the fuel economy of a single car at different speeds. In this situation p, C and A remain constant while the speed is different. Therefore, the quadratic drag model can be simplified to D = hv>, where h = PCA is a constant for a specific vehicle. A. If the vehicle experiences a drag force equal to D, when traveling at a speed Vs, what will the drag force, D., be when the vehicle is traveling at speed vz = 2v,? Express your answer in terms of D. (Hint: What is D, in terms of vi? How does this compare to the value of D.?) B. Recall from the tutorial that amount of kinetic energy transformed into thermal energy by the drag force interaction is equal to the magnitude of the drag force times the distance the object travels through the fluid: AEth air,drag = DAS According to this equation would you expect that this idealized vehicle could travel further on a gallon of gas at speed v, or vz? Explain your reasoning. C. Suppose that the vehicle gets 40 miles to the gallon when it is traveling at a speed of 60 mph Use Excel to construct a graph of the fuel economy of this idealized vehicle in mpg as a function of the vehicle speed in mph Attach a printout of this graph to this homework sheet Be sure to: Include a descriptive title on the graph Number and label the axes Include data for speeds ranging from 10 mph to 120 mph D. Now use the in the data provided in Canvas to create a graph of fuel economy vs. speed for one of the vehicles. Attach the graph for this actual vehicle. Be sure to: Include a descriptive title on the graph Number and label the axes Provide vehicle information (make, model, year) E. How does your idealized model compare with the real data? . B D E F. G H K speed (mph) Sonata (mpg) F-150 (mpg) Fuel Economy vs. Speed 0 0 0 60 5 13 13 10 23 24 50 15 35 32 40 20 42 35 25 46 37 Fuel Economy (mpg) 30 30 49 37 20 35 51 36 40 52 35 10 45 53 33 50 52 32 0 0 10 20 30 60 70 80 90 55 49 29 40 50 Speed (mph) 60 46 26 65 44 24 Sonata (mpg) F-150 (mpg) 70 40 22 75 36 19 80 33 18 Constructing a Semi-Empirical Model for Vehicle Fuel Efficiency In this homework you will use ideas about thermal energy generation from the tutorial to construct a model for vehicle miles per gallon vs. speed for a real-world vehicle. The model that you construct will be semi-empirical meaning that it will be partly based on theoretical ideas and partly based on data for an actual vehicle. I. Air Drag Car Model In a real vehicle, not all the chemical energy in the gasoline is transformed into kinetic energy of the moving car. We are going to begin by considering an idealized model for a car in which all the chemical energy released in the burning of fuel is used to propel the vehicle forward. Further, we will assume that the only force opposing the vehicle's forward motion is the drag force on the vehicle by the air. In this idealized model the increase in thermal energy associated with air drag is balance by the decrease in chemical energy in the gasoline. AEthair,drag + Echfuel = 0 Finally, we will use the common, "quadratic model for drag was described in the tutorial: DE CAv2 1 where: p is the density of the fluid through which the object is traveling, C is the drag coefficient which depends on the shape of the object, A is the cross-sectional area of the object, and vis the speed at which the object is moving through the fluid. In this analysis we will consider the fuel economy of a single car at different speeds. In this situation p, C and A remain constant while the speed is different. Therefore, the quadratic drag model can be simplified to D = hv>, where h = PCA is a constant for a specific vehicle. A. If the vehicle experiences a drag force equal to D, when traveling at a speed Vs, what will the drag force, D., be when the vehicle is traveling at speed vz = 2v,? Express your answer in terms of D. (Hint: What is D, in terms of vi? How does this compare to the value of D.?) B. Recall from the tutorial that amount of kinetic energy transformed into thermal energy by the drag force interaction is equal to the magnitude of the drag force times the distance the object travels through the fluid: AEth air,drag = DAS According to this equation would you expect that this idealized vehicle could travel further on a gallon of gas at speed v, or vz? Explain your reasoning. C. Suppose that the vehicle gets 40 miles to the gallon when it is traveling at a speed of 60 mph Use Excel to construct a graph of the fuel economy of this idealized vehicle in mpg as a function of the vehicle speed in mph Attach a printout of this graph to this homework sheet Be sure to: Include a descriptive title on the graph Number and label the axes Include data for speeds ranging from 10 mph to 120 mph D. Now use the in the data provided in Canvas to create a graph of fuel economy vs. speed for one of the vehicles. Attach the graph for this actual vehicle. Be sure to: Include a descriptive title on the graph Number and label the axes Provide vehicle information (make, model, year) E. How does your idealized model compare with the real data? . B D E F. G H K speed (mph) Sonata (mpg) F-150 (mpg) Fuel Economy vs. Speed 0 0 0 60 5 13 13 10 23 24 50 15 35 32 40 20 42 35 25 46 37 Fuel Economy (mpg) 30 30 49 37 20 35 51 36 40 52 35 10 45 53 33 50 52 32 0 0 10 20 30 60 70 80 90 55 49 29 40 50 Speed (mph) 60 46 26 65 44 24 Sonata (mpg) F-150 (mpg) 70 40 22 75 36 19 80 33 18


