

Question
constructing and Lorenz curve from personal income data the Smith Go tablets and the Johnson contact let's grew up across the street from each other
constructing and Lorenz curve from personal income data the Smith Go tablets and the Johnson contact let's grew up across the street from each other now in their forties the siblings earn the income shown in the following table
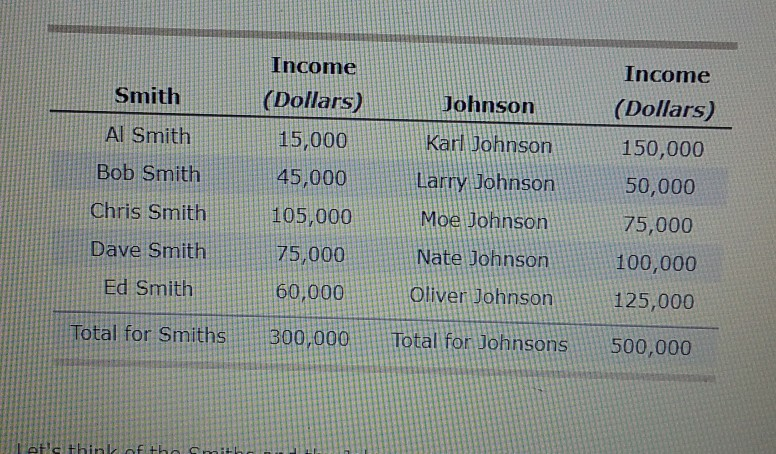
let's think of the Smiths and the Johnsons has to economies and analyze income inequality within each of the economies Dave Smith Share of the total Smith's income is____?_____ (35% ,5 % ,15% ,25%) Mo Johnson's share of the total Johnson income is ______?_______(10% ,30% ,15%, 20%)
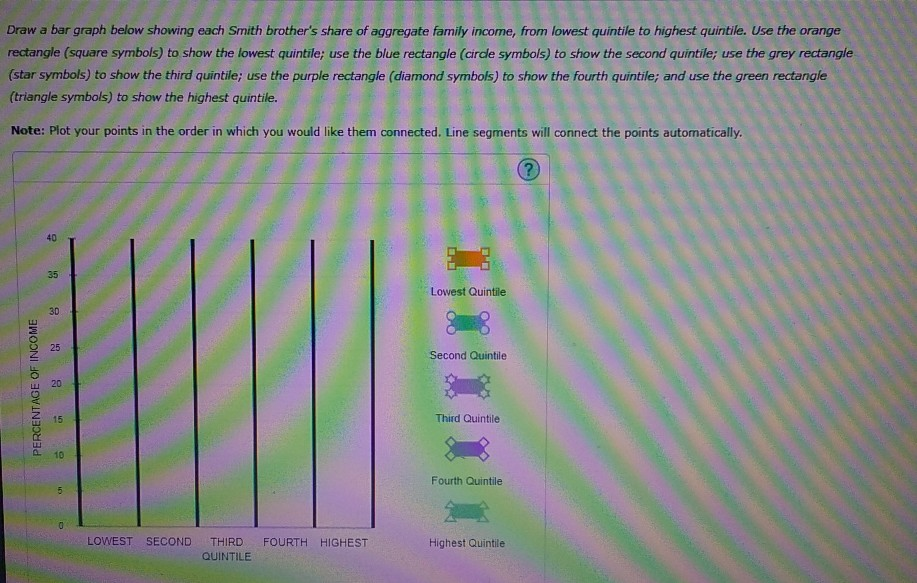
rank the Smiths brother's buy income from lowest to highest I'm calculate each brother share of the total Smith economy income because there are five brothers each Brothers represent of the income distribution.
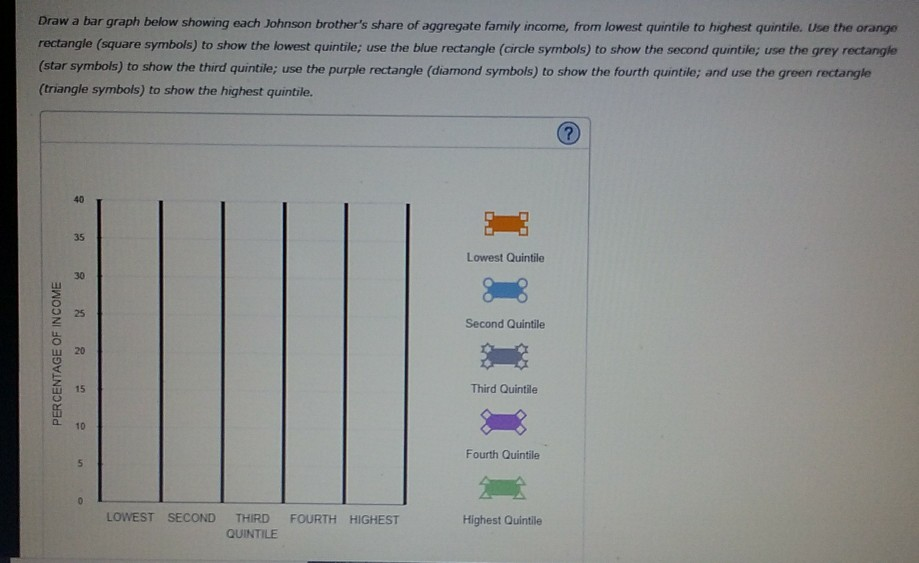
rank the Johnson Brothers by income from lowest to highest and calculate H Brothers share of the total Johnson economy income because there are five brothers each brother represents a quintile of income distribution.
on the following graph plot the Lorenz curve for the Smith economy using the green points triangle symbol then plot the Lorenz curve for the Johnson economy using the purple points diamond symbol you should think of each further as representing 20% of the total households in his respective economy
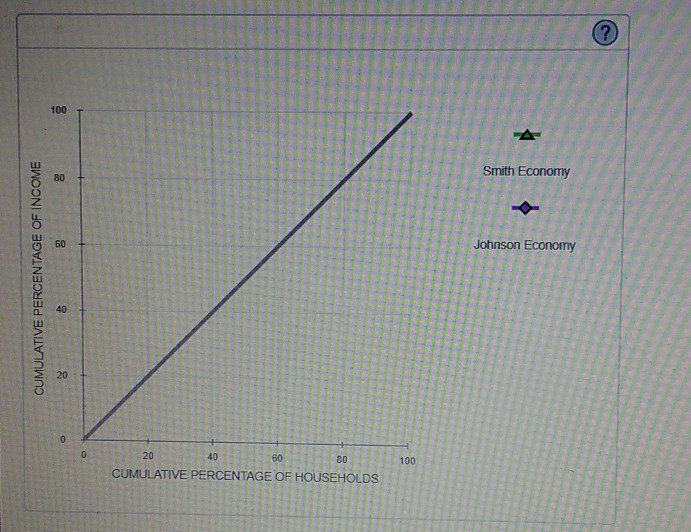
the ____?_____ (johhnson,smith) economy has more income inequality than the______?_____(johnson,smith) economy.
suppose that the Smiths decided that there is too much income inequality in their economy they vote to make Chris pay all a lump sum in order to be more like the Johnsons for the two economies Lorenz curves to become identical Chriss must give Al $____?______
Income Smith Al Smith Bob Smith Chris Smith Dave Smith Ed Smith Income (Dollars) Johnson 15,000 Karl Johnson 45,000 Larry Johnson 105,000 Moe Johnson 75,000 Nate Johnson 60,000 Oliver Johnson 300,000 || Total for Johnsons (Dollars) 150,000 50,000 75,000 100.000 125,000 500,000 Total for Smiths Draw a bar graph below showing each Smith brother's share of aggregate family income, from lowest quintile to highest quintile. Use the orange rectangle (square symbols) to show the lowest quintile; use the blue rectangle (circle symbols) to show the second quintile; use the grey rectang! (star symbols) to show the third quintile; use the purple rectangle (diamond symbols) to show the fourth quintile; and use the green rectangle (triangle symbols) to show the highest quintile. Note: Plot your points in the order in which you would like them connected. Line segments will connect the points automatically. Lowest Quintile Second Quintile PERCENTAGE OF INCOME Third Quintile Fourth Quintile LOWEST SECOND THIRD QUINTILE FOURTH HIGHEST Highest Quintile Draw a bar graph below showing each Johnson brother's share of aggregate family income, from lowest quintile to highest quintile. Use the orange rectangle (square symbols) to show the lowest quintile; use the blue rectangle (Circle symbols) to show the second quintile; use the grey rectangle (star symbols) to show the third quintile; use the purple rectangle (diamond symbols) to show the fourth quintile; and use the green rectangle (triangle symbols) to show the highest quintile. Lowest Quintile Second Quintile PERCENTAGE OF INCOME Third Quintile Fourth Quintile LOWEST SECOND THIRD QUINTILE FOURTH HIGHEST Highest Quintile Smith Economy Johnson Economy CUMULATIVE PERCENTAGE OF INCOME + 8 + SO CUMULATIVE PERCENTAGE OF HOUSEHOLDSStep by Step Solution
There are 3 Steps involved in it
Step: 1

Get Instant Access to Expert-Tailored Solutions
See step-by-step solutions with expert insights and AI powered tools for academic success
Step: 2

Step: 3
Ace Your Homework with AI
Get the answers you need in no time with our AI-driven, step-by-step assistance
Get Started
Research Methods And Audit In General Practice
Authors: David Armstrong, John Grace
1st Edition
0192624547, 978-0192624543