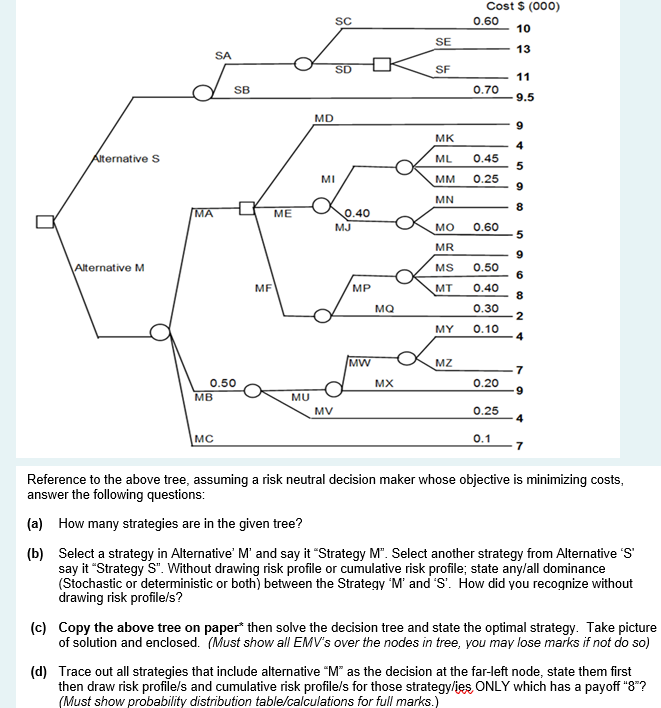
Cost $ (000) 0.60 10 SC SE 13 SA SD SF 11 SB 0.70 9.5 MD MK Alternative S ML 0.45 5 MI MM 0.25 9 MN 8 MA ME 0.40 MJ MO 0.60 5 MR 9 Alternative M MS 6 MF MP MT 0.50 0.40 0.30 8 2 MY 0.10 4 MW MZ 7 MX 0.50 MB 0.20 9 MU MV 0.25 4 MC 0.1 7 Reference to the above tree, assuming a risk neutral decision maker whose objective is minimizing costs, answer the following questions: (a) How many strategies are in the given tree? (b) Select a strategy in Alternative' M' and say it "Strategy M". Select another strategy from Alternative 'S' say it "Strategy S". Without drawing risk profile or cumulative risk profile, state any/all dominance (Stochastic or deterministic or both) between the Strategy 'M' and 'S'. How did you recognize without drawing risk profile/s? (c) Copy the above tree on paper* then solve the decision tree and state the optimal strategy. Take picture of solution and enclosed. (Must show all EMV's over the nodes in tree, you may lose marks if not do so) (d) Trace out all strategies that include alternative "M" as the decision at the far-left node, state them first then draw risk profile/s and cumulative risk profile/s for those strategy/ies ONLY which has a payoff "8"? (Must show probability distribution table/calculations for full marks.) Cost $ (000) 0.60 10 SC SE 13 SA SD SF 11 SB 0.70 9.5 MD MK Alternative S ML 0.45 5 MI MM 0.25 9 MN 8 MA ME 0.40 MJ MO 0.60 5 MR 9 Alternative M MS 6 MF MP MT 0.50 0.40 0.30 8 2 MY 0.10 4 MW MZ 7 MX 0.50 MB 0.20 9 MU MV 0.25 4 MC 0.1 7 Reference to the above tree, assuming a risk neutral decision maker whose objective is minimizing costs, answer the following questions: (a) How many strategies are in the given tree? (b) Select a strategy in Alternative' M' and say it "Strategy M". Select another strategy from Alternative 'S' say it "Strategy S". Without drawing risk profile or cumulative risk profile, state any/all dominance (Stochastic or deterministic or both) between the Strategy 'M' and 'S'. How did you recognize without drawing risk profile/s? (c) Copy the above tree on paper* then solve the decision tree and state the optimal strategy. Take picture of solution and enclosed. (Must show all EMV's over the nodes in tree, you may lose marks if not do so) (d) Trace out all strategies that include alternative "M" as the decision at the far-left node, state them first then draw risk profile/s and cumulative risk profile/s for those strategy/ies ONLY which has a payoff "8"? (Must show probability distribution table/calculations for full marks.)


