Question
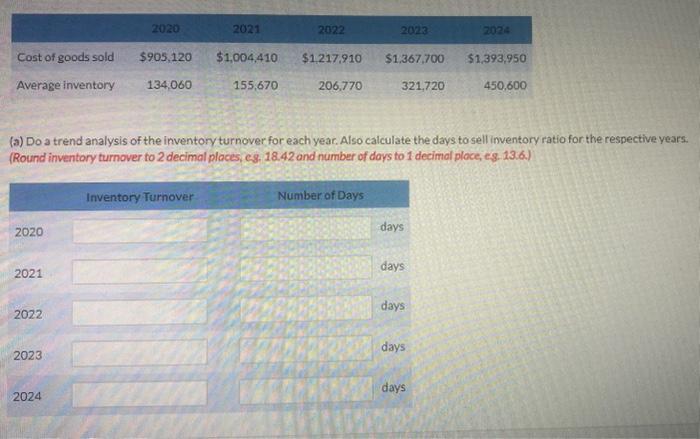
Do a trend analysis of the inventory turnover for each year. Also calculate the days to sell inventory ratio for the respective years. Cost of

Cost of goods sold Average inventory 2020 2021 2022 2023 2020 2024 $905,120 134,060 2021 Inventory Turnover $1,004,410 155,670 2022 $1,217,910 206,770 (a) Do a trend analysis of the inventory turnover for each year. Also calculate the days to sell inventory ratio for the respective years. (Round inventory turnover to 2 decimal places, eg. 18.42 and number of days to 1 decimal place, e.g. 13.6.) 2023 Number of Days $1,367,700 321,720 days days days days 2024 days $1,393,950 450,600
Step by Step Solution
3.55 Rating (155 Votes )
There are 3 Steps involved in it
Step: 1
Year Inventory turnover Number of days 2020 67 times 54 days 2021 645 times 565 ...
Get Instant Access to Expert-Tailored Solutions
See step-by-step solutions with expert insights and AI powered tools for academic success
Step: 2

Step: 3

Ace Your Homework with AI
Get the answers you need in no time with our AI-driven, step-by-step assistance
Get StartedRecommended Textbook for
Understanding Financial Accounting
Authors: Christopher D. Burnley
2nd Canadian Edition
1119406927, 978-1119406921
Students also viewed these Accounting questions
Question
Answered: 1 week ago
Question
Answered: 1 week ago
Question
Answered: 1 week ago
Question
Answered: 1 week ago
Question
Answered: 1 week ago
Question
Answered: 1 week ago
Question
Answered: 1 week ago
Question
Answered: 1 week ago
Question
Answered: 1 week ago
Question
Answered: 1 week ago
Question
Answered: 1 week ago
Question
Answered: 1 week ago
Question
Answered: 1 week ago
Question
Answered: 1 week ago
Question
Answered: 1 week ago
Question
Answered: 1 week ago
Question
Answered: 1 week ago
Question
Answered: 1 week ago
Question
Answered: 1 week ago
Question
Answered: 1 week ago
Question
Answered: 1 week ago
View Answer in SolutionInn App


