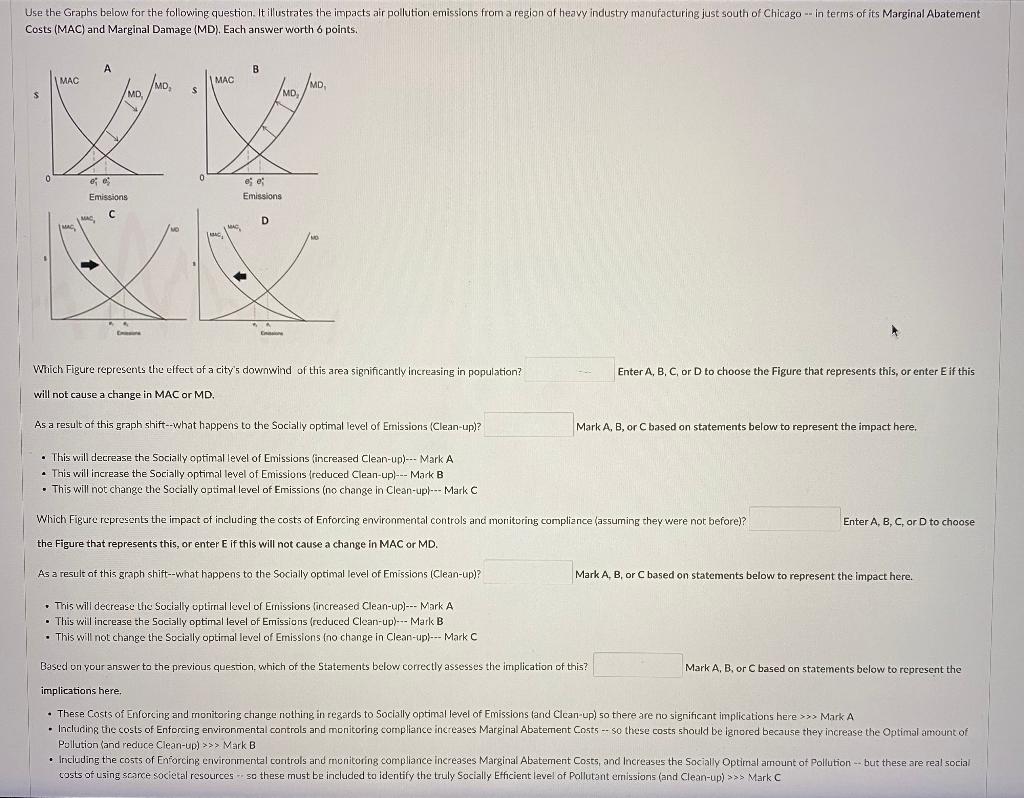
Costs (MAC) and Marginal Damage (MD). Each answer worth 6 points. will not cause a change in MAC or MD. As a result of this graph shift-what happens to the Socially optimal level of Emissions (Clean-up)? Mark A, B, or C based on statements below to represent the impact here. - This will decrease the Socially optimal level of Emissions (increased Clean-up)-.. Mark A - This vill increase the Socially optimal level of Emissions (reduced Clean-up)-- Mark B - This will not change the Socially optimal level of Emissions (no change in Clean-upl-Mark C Which Figure represents the impact of including the costs of Enforcing environmental controls and monitoring compliance assuming they were not before)? Enter A, B, C, or D to choose the Figure that represents this, or enter E if this will not cause a change in MAC or MD. As a result af this graph shift--what happens to the Socially optimal level of Emissions (Clean-up)? Mark A, B, or C based on statements below to represent the impact here. - This will decrease the Socially uptirral level of Emissions lincreased Clean-up)-- Mark A - This will increase the Socially optimal level of Emissions (reduced Clean-up)-1-Mark B - This will not change the Socially optimal level of Emissions fno change in Clean-upf-. Mark C Based on pour answer to the previous question, which of the Statements below correctly assesses the implication of this? Mark A,B, or C based on statements below to represent the implications here. Pollution (and reduce Clean-upj ark B costs of Ling scarce societal resources sc these must be included to identify the truly Socially Efficient level of Pollutant emissions (and Clean-up) >>y Mark C Costs (MAC) and Marginal Damage (MD). Each answer worth 6 points. will not cause a change in MAC or MD. As a result of this graph shift-what happens to the Socially optimal level of Emissions (Clean-up)? Mark A, B, or C based on statements below to represent the impact here. - This will decrease the Socially optimal level of Emissions (increased Clean-up)-.. Mark A - This vill increase the Socially optimal level of Emissions (reduced Clean-up)-- Mark B - This will not change the Socially optimal level of Emissions (no change in Clean-upl-Mark C Which Figure represents the impact of including the costs of Enforcing environmental controls and monitoring compliance assuming they were not before)? Enter A, B, C, or D to choose the Figure that represents this, or enter E if this will not cause a change in MAC or MD. As a result af this graph shift--what happens to the Socially optimal level of Emissions (Clean-up)? Mark A, B, or C based on statements below to represent the impact here. - This will decrease the Socially uptirral level of Emissions lincreased Clean-up)-- Mark A - This will increase the Socially optimal level of Emissions (reduced Clean-up)-1-Mark B - This will not change the Socially optimal level of Emissions fno change in Clean-upf-. Mark C Based on pour answer to the previous question, which of the Statements below correctly assesses the implication of this? Mark A,B, or C based on statements below to represent the implications here. Pollution (and reduce Clean-upj ark B costs of Ling scarce societal resources sc these must be included to identify the truly Socially Efficient level of Pollutant emissions (and Clean-up) >>y Mark C