

Answered step by step
Verified Expert Solution
Question
1 Approved Answer
could u analyse this relaition like this 2. GPA vs Volunteering hours: 3. The uses of devices support Al and the trust of Al Figure
could u analyse this relaition 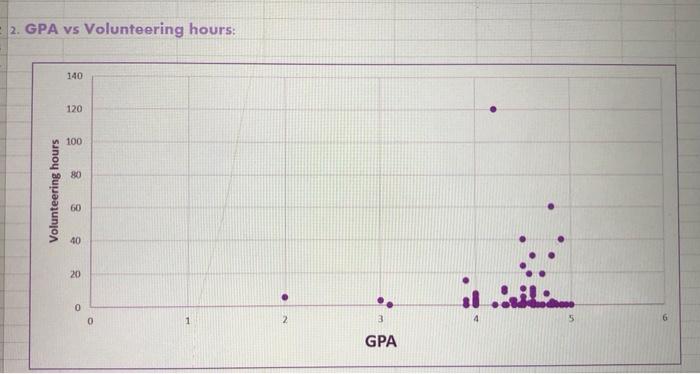
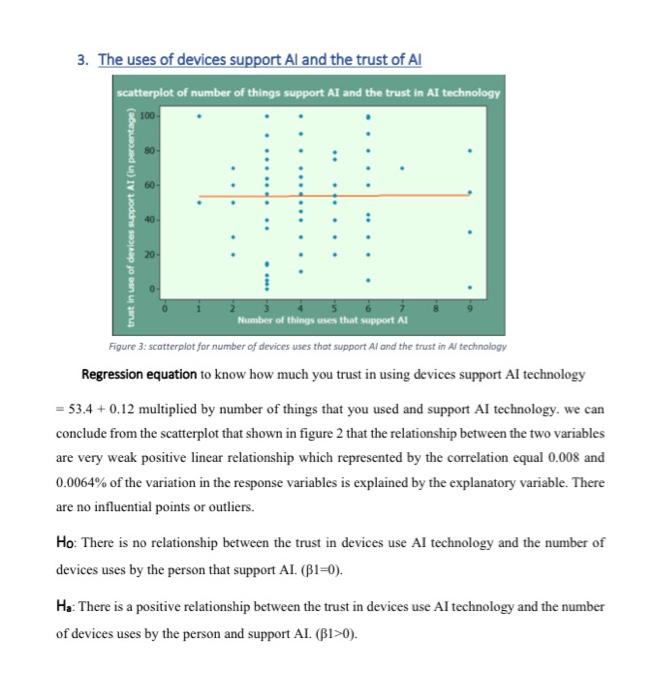
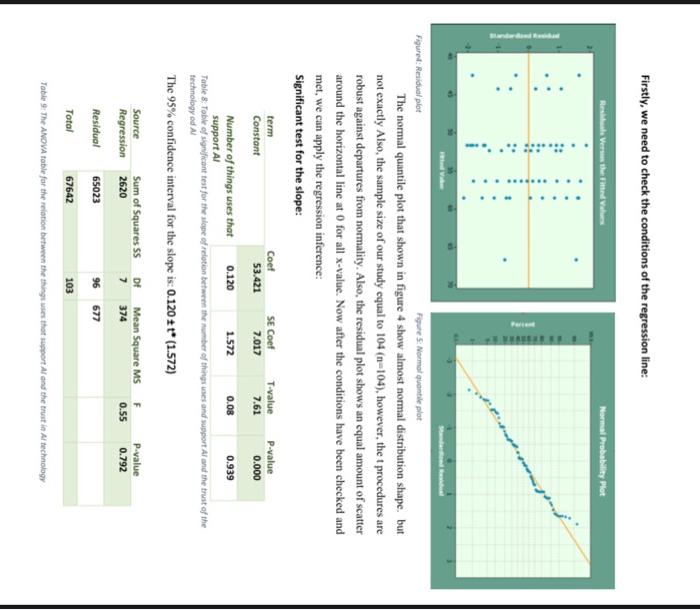
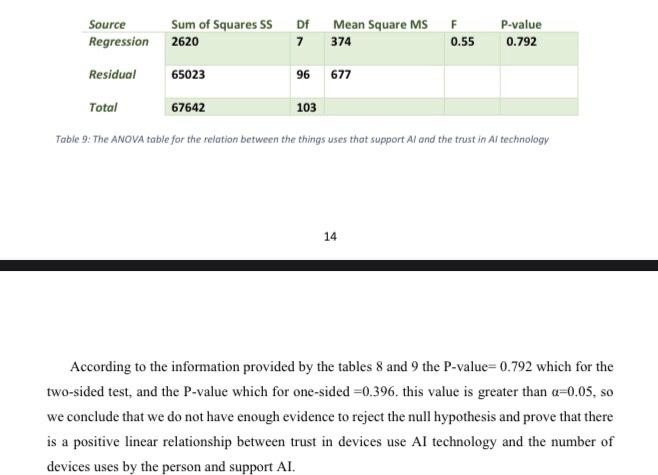
2. GPA vs Volunteering hours: 3. The uses of devices support Al and the trust of Al Figure 3: scatterpiot for number of devices wses that support All and the trust in A technology Regression equation to know how much you trust in using devices support Al technology =53.4+0.12 multiplied by number of things that you used and support AI technology. we can conclude from the scatterplot that shown in figure 2 that the relationship between the two variables are very weak positive linear relationship which represented by the correlation equal 0.008 and 0.0064% of the variation in the response variables is explained by the explanatory variable. There are no influential points or outliers. Ho: There is no relationship between the trust in devices use AI technology and the number of devices uses by the person that support AI. (1=0). Ha : There is a positive relationship between the trust in devices use AI technology and the number of devices uses by the person and support AI. (1>0). Firstly, we need to check the conditions of the regression line: The normal quantile plot that shown in figure 4 show almost normal distribution shape. but not exactly Also, the sample size of our study equal to 104(n104), however, the t procedures are robust against departures from normality. Also, the residual plot shows an equal amount of scatter around the horizontal line at 0 for all x-value. Now after the conditions have been checked and met, we can apply the regression inference: Significant test for the slope: Table 8. Toble of sigrificant test for the slape of relotion betweren the number of things uses and support Al and the trust of the tertanology ad A The 95% confidence interval for the slope is: 0.120t(1.572) Tabie 9: The ANOVA fable for the relarion berween the things uses thot support A and the trust in Ar technology Table 9: The ANOVA table for the relation between the things uses that support Al and the trust in Al technology 14 According to the information provided by the tables 8 and 9 the P-value =0.792 which for the two-sided test, and the P-value which for one-sided =0.396. this value is greater than =0.05, so we conclude that we do not have enough evidence to reject the null hypothesis and prove that there is a positive linear relationship between trust in devices use AI technology and the number of devices uses by the person and support AI like this
Step by Step Solution
There are 3 Steps involved in it
Step: 1

Get Instant Access to Expert-Tailored Solutions
See step-by-step solutions with expert insights and AI powered tools for academic success
Step: 2

Step: 3
Ace Your Homework with AI
Get the answers you need in no time with our AI-driven, step-by-step assistance
Get Started
Database And Expert Systems Applications 22nd International Conference Dexa 2011 Toulouse France August/September 2011 Proceedings Part 1 Lncs 6860
Authors: Abdelkader Hameurlain ,Stephen W. Liddle ,Klaus-Dieter Schewe ,Xiaofang Zhou
2011th Edition