Answered step by step
Verified Expert Solution
Link Copied!

Question

1 Approved Answer

could u help me with this 3. The table below presents the descriptive statistics for three different site locations: A, B, and C. Use the

could u help me with this
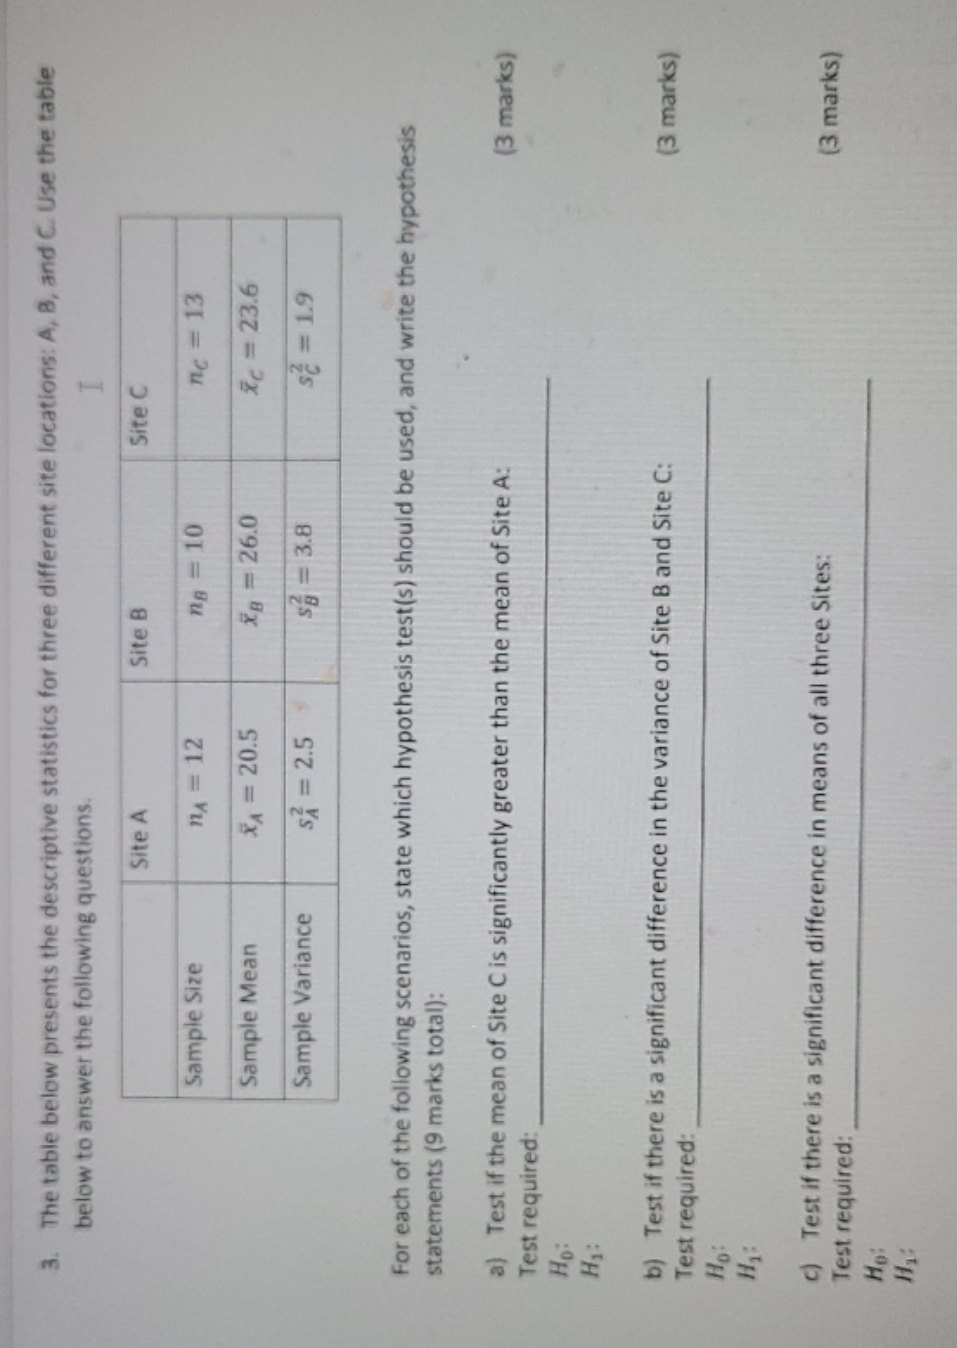
image text in transcribed
3. The table below presents the descriptive statistics for three different site locations: A, B, and C. Use the table below to answer the following questions. Site A Site B Site C Sample Size nA = 12 ng = 10 nc = 13 Sample Mean XA = 20.5 XB = 26.0 Xc = 23.6 Sample Variance SA = 2.5 $6 = 3.8 SC = 1.9 For each of the following scenarios, state which hypothesis test(s) should be used, and write the hypothesis statements (9 marks total): a) Test if the mean of Site C is significantly greater than the mean of Site A: (3 marks) Test required: H1: b) Test if there is a significant difference in the variance of Site B and Site C: (3 marks) Test required: Ho c) Test if there is a significant difference in means of all three Sites: Test required: (3 marks) Ho

Step by Step Solution

There are 3 Steps involved in it

Step: 1

blur-text-image

Get Instant Access to Expert-Tailored Solutions

See step-by-step solutions with expert insights and AI powered tools for academic success

Step: 2

blur-text-image_2

Step: 3

blur-text-image_3

Ace Your Homework with AI

Get the answers you need in no time with our AI-driven, step-by-step assistance

Get Started

Recommended Textbook for

Practical Linear Algebra A Geometry Toolbox

Authors: Gerald Farin, Dianne Hansford

4th Edition

1003051219, 9781003051213

More Books

Students also viewed these Mathematics questions

Question

3. Explain inductive analysis.

Answered: 1 week ago

Question

1. Which is the most abundant gas presented in the atmosphere?

Answered: 1 week ago