Answered step by step
Verified Expert Solution
Question
1 Approved Answer
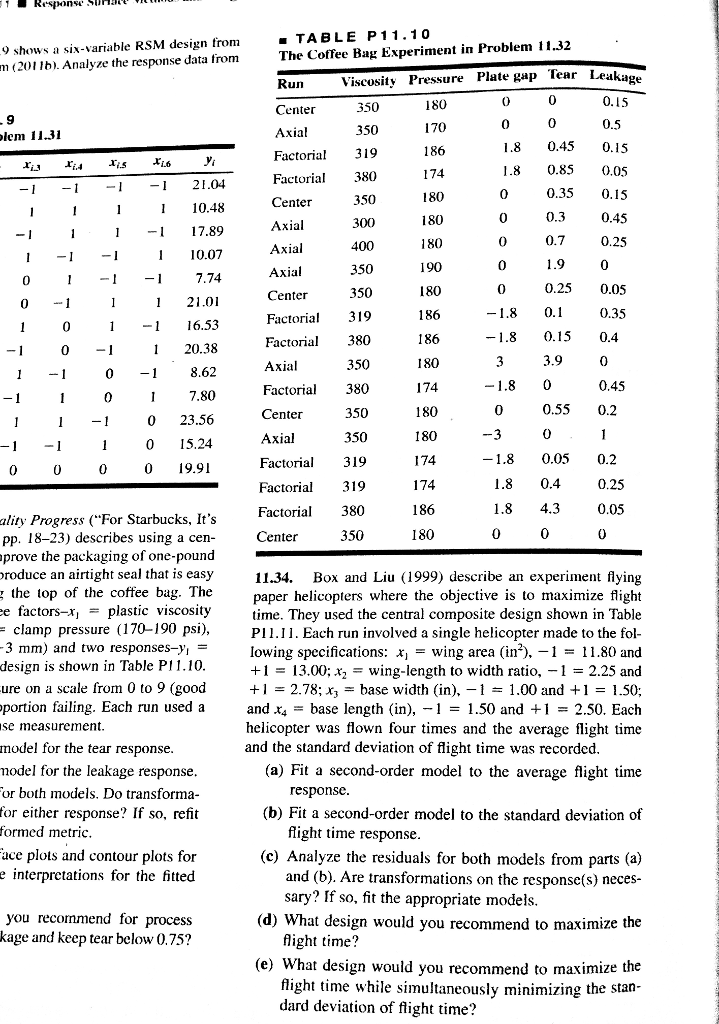
Could you show how to do questions 34 in minitab? Thanks 9 shows a six-variable RSM design from (201 1b). Analyze the response data from


Could you show how to do questions 34 in minitab? Thanks
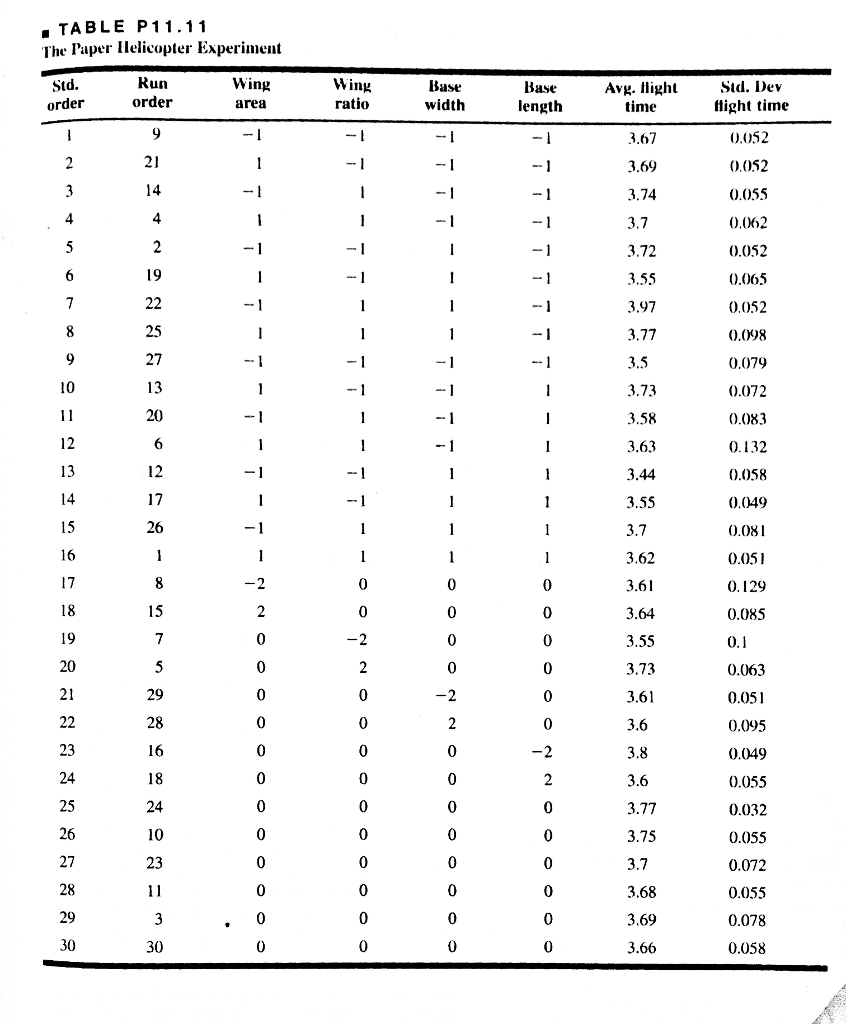
9 shows a six-variable RSM design from (201 1b). Analyze the response data from TABLE P11.10 The Cotfee Bag Experiment in Problem 11.32 m Viscosity Pressure Plate gap Tear Leaka Kun Center 9 lem 11.31 0 350 18 0.45 0.15 1.8 0.85 0.05 0.35 0.15 186 Factorial 319 Factoria Center 180 17.89 10.07 7.74 400 350 0 0.250.05 Center 0.35 Factorial 319 Factorial380 350 Factorial 380 350 350 Factorial 319 Factorial 319 Factorial380 350 0 1.8 0.15 0.4 0 120.38 0.45 Center 180 0.55 0.2 0 23.56 0 15.24 0 19.91 Axial 1.8 0.05 0.2 186 0.05 ality Progress ("For Starbucks, It's pp. 18-23) describes using a cen- prove the packaging of one-pound roduce an airtight seal that is easy Center 180 11.34. Box and Liu (1999) describe an experiment flying paper helicopters where the objective is to maximize flight time. They used the central composite design shown in Tabl,e P11.11. Each run involved a single helicopter made to the fol lowing specifications: " = wing area (in2),-1 = 11.80 and +1 13.00: = wing-length to width ratio,-1 = 2.25 and +1 = 2.78; x3-base width (in),-1-1.00 and +1 = 1.50; and x4 = base length (in),-1 = 1.50 and +1 = 2.50. Each helicopter was flown four times and the average flight time the top of the coffee bag. The e factors-x plastic viscosity clamp pressure (170-190 psi), 3 mm) and two responses-yi - design is shown in Table P11.10 ure on a scale from 0 to 9 (good portion failing. Each run used a se measurement model for the tear response nodel for the leakage response or both models. Do transforma for either response? If so, refit formed metric and the standard deviation of flight time was recorded. (a) Fit a second-order model to the average flight time response (b) Fit a second-order model to the standard deviation of flight time response ace plots and contour plots for e interpretations for the fitted (c) Analyze the residuals for both models from parts (a) and (b). Are transformations on the response(s) neces- sary? If so, fit the appropriate models you recommend for process kage and keep tear below 0.75? (d) What design would you recommend to maximize the flight time? (e) What design would you recommend to maximize the flight time while simultaneously minimizing the stan dard deviation of fight timeStep by Step Solution
There are 3 Steps involved in it
Step: 1

Get Instant Access to Expert-Tailored Solutions
See step-by-step solutions with expert insights and AI powered tools for academic success
Step: 2

Step: 3

Ace Your Homework with AI
Get the answers you need in no time with our AI-driven, step-by-step assistance
Get Started


