

Answered step by step
Verified Expert Solution
Question
1 Approved Answer
Course: 202401_1034-BA_216_02-FIRST YEAR ACCO..... Chapter 23 Data Analysis C CengageNOWv2 | Online teaching and learning resource.... Activity Raw Data Analysis Using Excel Completing this activity
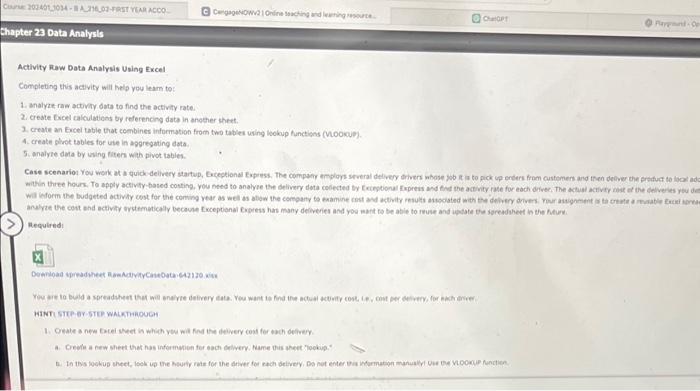
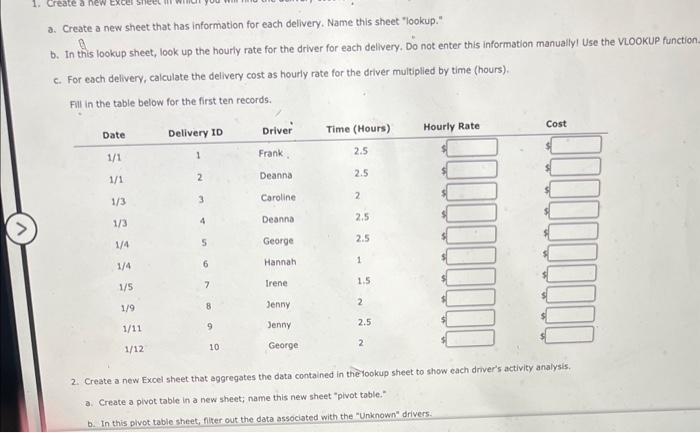
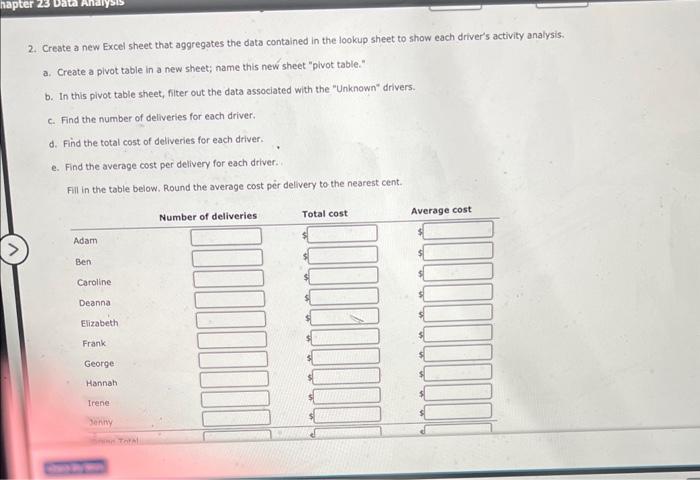
Course: 202401_1034-BA_216_02-FIRST YEAR ACCO..... Chapter 23 Data Analysis C CengageNOWv2 | Online teaching and learning resource.... Activity Raw Data Analysis Using Excel Completing this activity will help you learn to: 1. analyze raw activity data to find the activity rate. 2. create Excel calculations by referencing data in another sheet. 3. create an Excel table that combines information from two tables using lookup functions (VLOOKUP). 4. create pivot tables for use in aggregating data. 5. analyze data by using filters with pivot tables. ChatGPT Download spreadsheet RawActivity CaseData-642120.xlsx Case scenario: You work at a quick-delivery startup, Exceptional Express. The company employs several delivery drivers whose job it is to pick up orders from customers and then deliver the product to local adc within three hours. To apply activity-based costing, you need to analyze the delivery data collected by Exceptional Express and find the activity rate for each driver. The actual activity cost of the deliveries you det will inform the budgeted activity cost for the coming year as well as allow the company to examine cost and activity results associated with the delivery drivers. Your assignment is to create a reusable Excel sprea analyze the cost and activity systematically because Exceptional Express has many deliveries and you want to be able to reuse and update the spreadsheet in the future. > Required: Playground - Op You are to build a spreadsheet that will analyze delivery data. You want to find the actual activity cost, i.e., cost per delivery, for each driver. HINT: STEP-BY-STEP WALKTHROUGH 1. Create a new Excel sheet in which you will find the delivery cost for each delivery. a. Create a new sheet that has information for each delivery. Name this sheet "lookup." b. In this lookup sheet, look up the hourly rate for the driver for each delivery. Do not enter this information manually! Use the VLOOKUP function.
Step by Step Solution
There are 3 Steps involved in it
Step: 1

Get Instant Access to Expert-Tailored Solutions
See step-by-step solutions with expert insights and AI powered tools for academic success
Step: 2

Step: 3
Ace Your Homework with AI
Get the answers you need in no time with our AI-driven, step-by-step assistance
Get Started
Management Accounting
Authors: Charles T. Horngren, Gary L. Sundem, William O. Stratton, Phillip Beaulieu
6th Canadian edition
013257084X, 1846589207, 978-0132570848