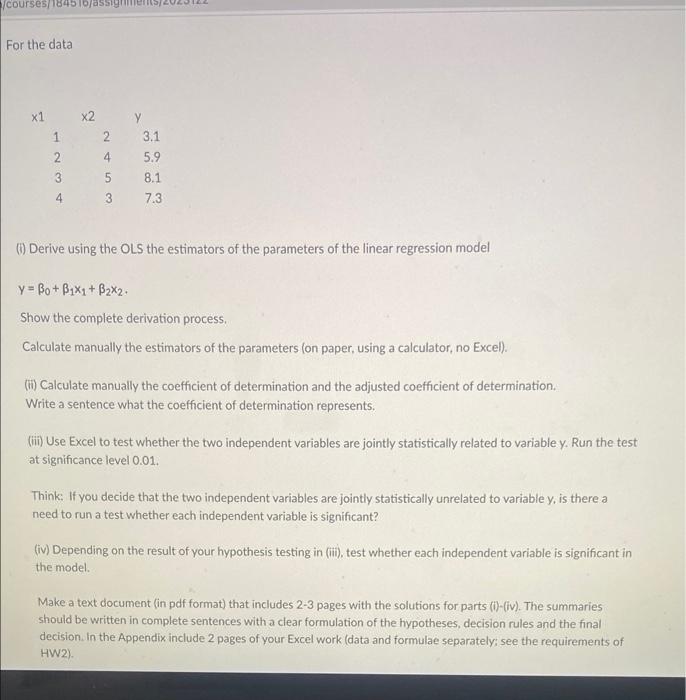
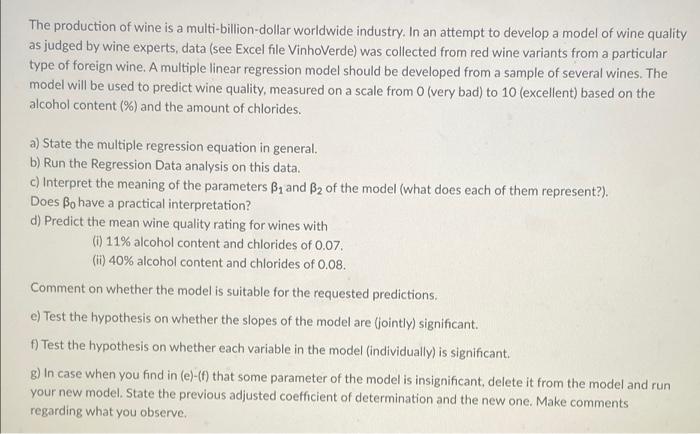
/courses/1845 16/assign For the data x1 x2 1 2 3.1 5.9 3 5 8.1 4 3 7.3 (1) Derive using the OLS the estimators of the parameters of the linear regression model y=Bo+ B1x1+ B2x2. Show the complete derivation process. Calculate manually the estimators of the parameters (on paper, using a calculator, no Excel). (ii) Calculate manually the coefficient of determination and the adjusted coefficient of determination. Write a sentence what the coefficient of determination represents. (iii) Use Excel to test whether the two independent variables are jointly statistically related to variable y. Run the test at significance level 0.01. Think: If you decide that the two independent variables are jointly statistically unrelated to variable y, is there a need to run a test whether each independent variable is significant? (iv) Depending on the result of your hypothesis testing in (iii), test whether each independent variable is significant in the model. Make a text document (in pdf format) that includes 2-3 pages with the solutions for parts (i)-(iv). The summaries should be written in complete sentences with a clear formulation of the hypotheses, decision rules and the final decision. In the Appendix include 2 pages of your Excel work (data and formulae separately; see the requirements of HW2). y 2 4 The production of wine is a multi-billion-dollar worldwide industry. In an attempt to develop a model of wine quality as judged by wine experts, data (see Excel file VinhoVerde) was collected from red wine variants from a particular type of foreign wine. A multiple linear regression model should be developed from a sample of several wines. The model will be used to predict wine quality, measured on a scale from 0 (very bad) to 10 (excellent) based on the alcohol content (%) and the amount of chlorides. a) State the multiple regression equation in general. b) Run the Regression Data analysis on this data. c) Interpret the meaning of the parameters B and B2 of the model (what does each of them represent?). Does Bo have a practical interpretation? d) Predict the mean wine quality rating for wines with (i) 11% alcohol content and chlorides of 0.07. (ii) 40% alcohol content and chlorides of 0.08. Comment on whether the model is suitable for the requested predictions. e) Test the hypothesis on whether the slopes of the model are (jointly) significant. f) Test the hypothesis on whether each variable in the model (individually) is significant. g) In case when you find in (e)-(f) that some parameter of the model is insignificant, delete it from the model and run your new model. State the previous adjusted coefficient of determination and the new one. Make comments regarding what you observe. /courses/1845 16/assign For the data x1 x2 1 2 3.1 5.9 3 5 8.1 4 3 7.3 (1) Derive using the OLS the estimators of the parameters of the linear regression model y=Bo+ B1x1+ B2x2. Show the complete derivation process. Calculate manually the estimators of the parameters (on paper, using a calculator, no Excel). (ii) Calculate manually the coefficient of determination and the adjusted coefficient of determination. Write a sentence what the coefficient of determination represents. (iii) Use Excel to test whether the two independent variables are jointly statistically related to variable y. Run the test at significance level 0.01. Think: If you decide that the two independent variables are jointly statistically unrelated to variable y, is there a need to run a test whether each independent variable is significant? (iv) Depending on the result of your hypothesis testing in (iii), test whether each independent variable is significant in the model. Make a text document (in pdf format) that includes 2-3 pages with the solutions for parts (i)-(iv). The summaries should be written in complete sentences with a clear formulation of the hypotheses, decision rules and the final decision. In the Appendix include 2 pages of your Excel work (data and formulae separately; see the requirements of HW2). y 2 4 The production of wine is a multi-billion-dollar worldwide industry. In an attempt to develop a model of wine quality as judged by wine experts, data (see Excel file VinhoVerde) was collected from red wine variants from a particular type of foreign wine. A multiple linear regression model should be developed from a sample of several wines. The model will be used to predict wine quality, measured on a scale from 0 (very bad) to 10 (excellent) based on the alcohol content (%) and the amount of chlorides. a) State the multiple regression equation in general. b) Run the Regression Data analysis on this data. c) Interpret the meaning of the parameters B and B2 of the model (what does each of them represent?). Does Bo have a practical interpretation? d) Predict the mean wine quality rating for wines with (i) 11% alcohol content and chlorides of 0.07. (ii) 40% alcohol content and chlorides of 0.08. Comment on whether the model is suitable for the requested predictions. e) Test the hypothesis on whether the slopes of the model are (jointly) significant. f) Test the hypothesis on whether each variable in the model (individually) is significant. g) In case when you find in (e)-(f) that some parameter of the model is insignificant, delete it from the model and run your new model. State the previous adjusted coefficient of determination and the new one. Make comments regarding what you observe