Create A Balance Sheet and Income Statement with the provided information from the cash flow projections and other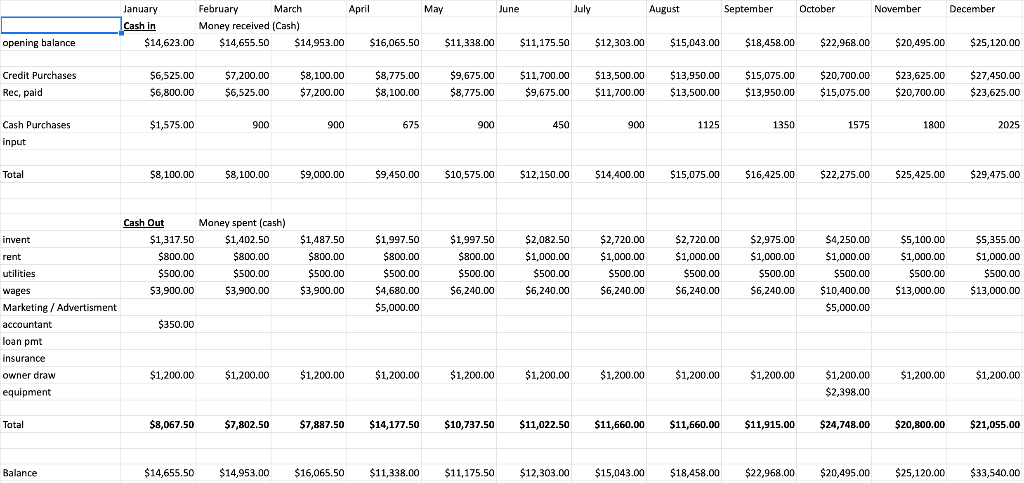
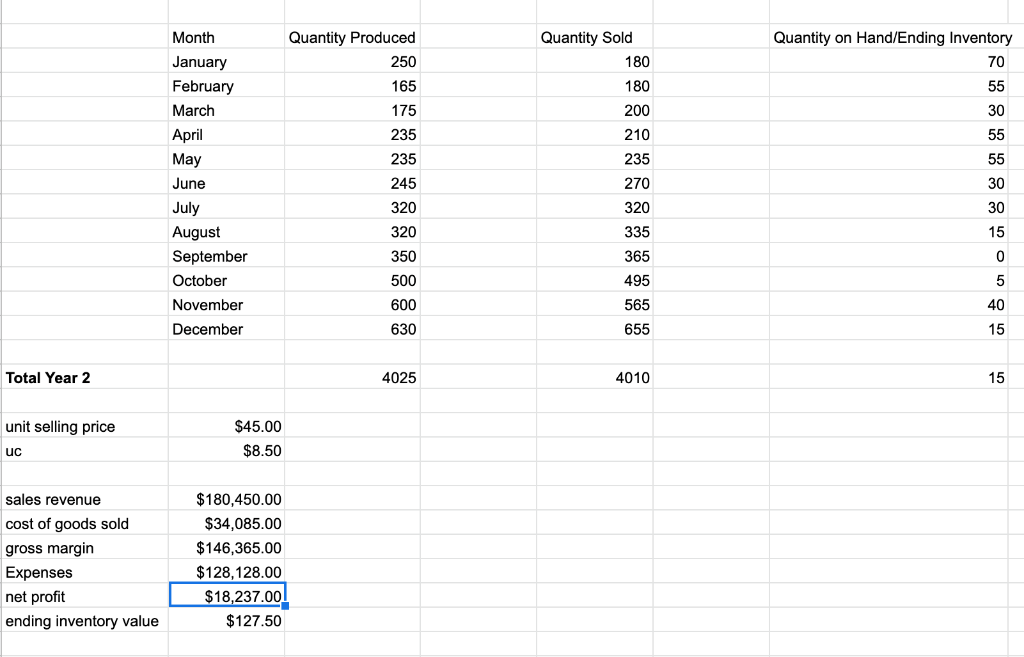
May June July August September October November December January February March April Cash in Money received (Cash) $14,623.00 $14,655.50 $14,953.00 $16,065.50 opening balance $11,338.00 $11,175.50 $12,303.00 $15,043.00 $18,458.00 $22,968.00 $20,495.00 $25,120.00 $7,200.00 Credit Purchases Rec, paid $6,525.00 $6,800.00 $8,100.00 $7,200.00 $8,775.00 $8,100.00 $9,675.00 $8,775.00 $11,700.00 $9.675.00 $13,500.00 $11,700.00 $13,950.00 $13,500.00 $15,075.00 $13,950.00 $20,700.00 $15,075.00 $23,625.00 $20,700.00 $27,450.00 $23,625.00 $6,525.00 $1,575.00 900 900 675 900 450 900 1125 1350 1575 1800 2025 Cash Purchases input Total $8,100.00 $8,100.00 $9,000.00 $9,450.00 $10.575.00 $12,150.00 $14,400.00 $15,075.00 $16,425.00 $22,275.00 $25,425.00 $29,475,00 $1.487.50 $1.997.50 $5,355,00 invent rent utilities wages Marketing / Advertisment accountant loan pmt Cash Out Money spent (cash) $1,317,50 $1,402.50 $800.00 $800.00 $500.00 $500.00 $3,900.00 $3,900.00 $800.00 $500.00 $3,900.00 $800.00 $500.00 $4,680.00 $5,000.00 $1,997.50 $800.00 $500.00 $6,240.00 $2,082.50 $1,000.00 $500.00 $6,240.00 $2,720.00 $1,000.00 $500.00 $6,240.00 $2,720.00 $1,000.00 $500.00 $6,240.00 $2,975.00 $1,000.00 $500.00 $6,240.00 $4,250.00 $1,000.00 $500.00 $10,400.00 $5,000.00 $5,100.00 $1,000.00 $500.00 $13,000.00 $1,000.00 $500.00 $13,000.00 $350.00 insurance owner draw equipment $1,200.00 $1,200.00 $1,200.00 $1,200.00 $1,200.00 $1,200.00 $1,200.00 $1,200.00 $1,200.00 $1,200.00 $1,200.00 $1,200.00 $2,398.00 Total $8,067.50 $7,802.50 $7,887.50 $14,177.50 $10,737.50 $11,022.50 $11,660.00 $11,660.00 $11,915.00 $24,748.00 $20,800.00 $21,055.00 Balance $14,655.50 $14,953.00 $16,065.50 $11,338.00 $11,175.50 $12,303.00 $15,043.00 $18,458.00 $22,968.00 $20,495.00 $25,120.00 $33,540.00 Month Quantity on Hand/Ending Inventory 70 Quantity Produced 250 165 175 235 Quantity Sold 180 180 200 210 55 30 55 235 235 55 245 January February March April May June July August September October November December 30 30 320 320 15 350 270 320 335 365 495 565 655 0 500 600 5 40 15 630 Total Year 2 4025 4010 15 unit selling price $45.00 $8.50 uc sales revenue cost of goods sold gross margin Expenses net profit ending inventory value $180,450.00 $34,085.00 $146,365.00 $128,128.00 $18,237.00! $127.50 May June July August September October November December January February March April Cash in Money received (Cash) $14,623.00 $14,655.50 $14,953.00 $16,065.50 opening balance $11,338.00 $11,175.50 $12,303.00 $15,043.00 $18,458.00 $22,968.00 $20,495.00 $25,120.00 $7,200.00 Credit Purchases Rec, paid $6,525.00 $6,800.00 $8,100.00 $7,200.00 $8,775.00 $8,100.00 $9,675.00 $8,775.00 $11,700.00 $9.675.00 $13,500.00 $11,700.00 $13,950.00 $13,500.00 $15,075.00 $13,950.00 $20,700.00 $15,075.00 $23,625.00 $20,700.00 $27,450.00 $23,625.00 $6,525.00 $1,575.00 900 900 675 900 450 900 1125 1350 1575 1800 2025 Cash Purchases input Total $8,100.00 $8,100.00 $9,000.00 $9,450.00 $10.575.00 $12,150.00 $14,400.00 $15,075.00 $16,425.00 $22,275.00 $25,425.00 $29,475,00 $1.487.50 $1.997.50 $5,355,00 invent rent utilities wages Marketing / Advertisment accountant loan pmt Cash Out Money spent (cash) $1,317,50 $1,402.50 $800.00 $800.00 $500.00 $500.00 $3,900.00 $3,900.00 $800.00 $500.00 $3,900.00 $800.00 $500.00 $4,680.00 $5,000.00 $1,997.50 $800.00 $500.00 $6,240.00 $2,082.50 $1,000.00 $500.00 $6,240.00 $2,720.00 $1,000.00 $500.00 $6,240.00 $2,720.00 $1,000.00 $500.00 $6,240.00 $2,975.00 $1,000.00 $500.00 $6,240.00 $4,250.00 $1,000.00 $500.00 $10,400.00 $5,000.00 $5,100.00 $1,000.00 $500.00 $13,000.00 $1,000.00 $500.00 $13,000.00 $350.00 insurance owner draw equipment $1,200.00 $1,200.00 $1,200.00 $1,200.00 $1,200.00 $1,200.00 $1,200.00 $1,200.00 $1,200.00 $1,200.00 $1,200.00 $1,200.00 $2,398.00 Total $8,067.50 $7,802.50 $7,887.50 $14,177.50 $10,737.50 $11,022.50 $11,660.00 $11,660.00 $11,915.00 $24,748.00 $20,800.00 $21,055.00 Balance $14,655.50 $14,953.00 $16,065.50 $11,338.00 $11,175.50 $12,303.00 $15,043.00 $18,458.00 $22,968.00 $20,495.00 $25,120.00 $33,540.00 Month Quantity on Hand/Ending Inventory 70 Quantity Produced 250 165 175 235 Quantity Sold 180 180 200 210 55 30 55 235 235 55 245 January February March April May June July August September October November December 30 30 320 320 15 350 270 320 335 365 495 565 655 0 500 600 5 40 15 630 Total Year 2 4025 4010 15 unit selling price $45.00 $8.50 uc sales revenue cost of goods sold gross margin Expenses net profit ending inventory value $180,450.00 $34,085.00 $146,365.00 $128,128.00 $18,237.00! $127.50