Answered step by step
Verified Expert Solution
Question
1 Approved Answer
Create a class that does the following: Create a private method that will generate random values in the range 0-1. Look at the examples
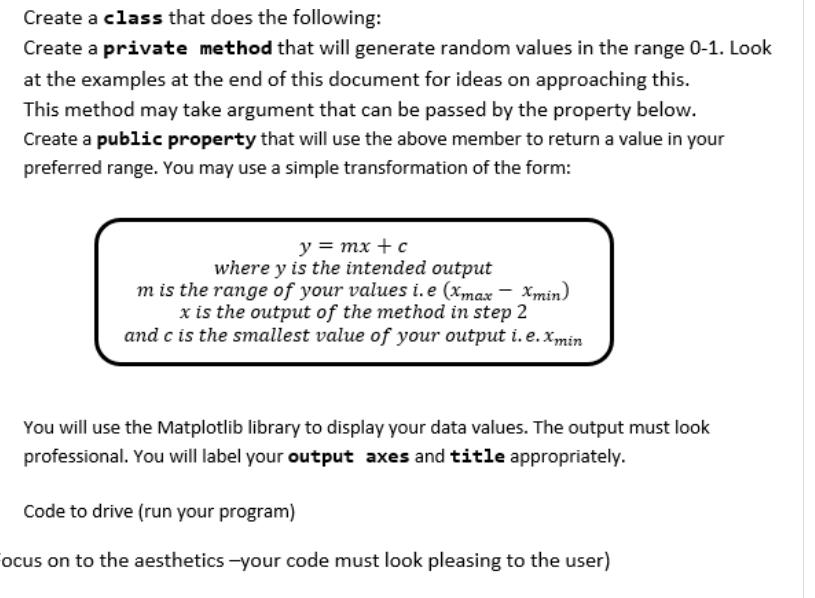
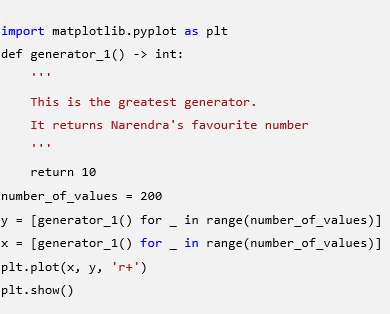
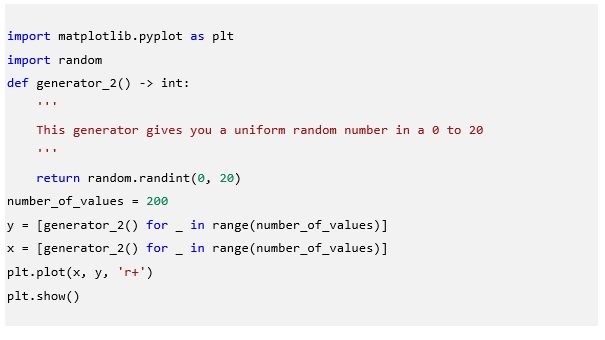
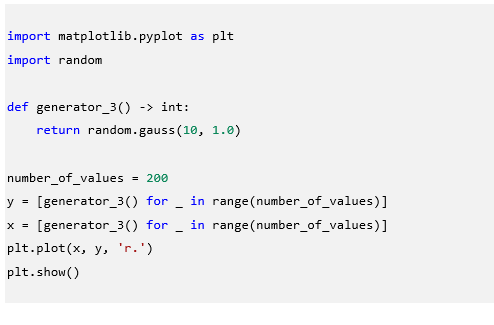
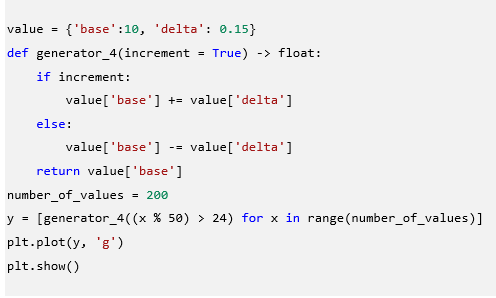
Create a class that does the following: Create a private method that will generate random values in the range 0-1. Look at the examples at the end of this document for ideas on approaching this. This method may take argument that can be passed by the property below. Create a public property that will use the above member to return a value in your preferred range. You may use a simple transformation of the form: y = mx + c where y is the intended output m is the range of your values i.e (xmax xmin) x is the output of the method in step 2 and c is the smallest value of your output i.e.xmin You will use the Matplotlib library to display your data values. The output must look professional. You will label your output axes and title appropriately. Code to drive (run your program) ocus on to the aesthetics -your code must look pleasing to the user) import matplotlib.pyplot as plt def generator_1() -> int: This is the greatest generator. It returns Narendra's favourite number return 10 number_of_values = 200 y = [generator_1() for in range (number_of_values)] [generator_1() for in range (number_of_values)] plt.plot(x, y, 'r+') plt.show() - - import matplotlib.pyplot as plt import random def generator_2() -> int: This generator gives you a uniform random number in a 0 to 20 return random.randint(0, 20) number_of_values = 200 y = [generator_2() for in range(number_of_values)] X = [generator_2() for in range (number_of_values)] plt.plot(x, y, 'r+') plt.show() - import matplotlib.pyplot as plt import random def generator_3() -> int: return random.gauss(10, 1.0) number_of_values = 200 y = [generator_3() for in range(number_of_values)] X = [generator_3() for in range (number_of_values)] plt.plot(x, y, r.) plt.show() value= {'base:10, 'delta': 0.15} def generator_4(increment =True) -> float: if increment: y value['base'] += value['delta'] value ['base'] return value ['base'] number_of_values = 200 [generator_4((x % 50) 24) for x in range(number_of_values)] = else: plt.plot(y, 'g') plt.show() -= value['delta']
Step by Step Solution
There are 3 Steps involved in it
Step: 1

Get Instant Access to Expert-Tailored Solutions
See step-by-step solutions with expert insights and AI powered tools for academic success
Step: 2

Step: 3

Ace Your Homework with AI
Get the answers you need in no time with our AI-driven, step-by-step assistance
Get Started


