Create a financial analysis for Walmart 2018 and 2019
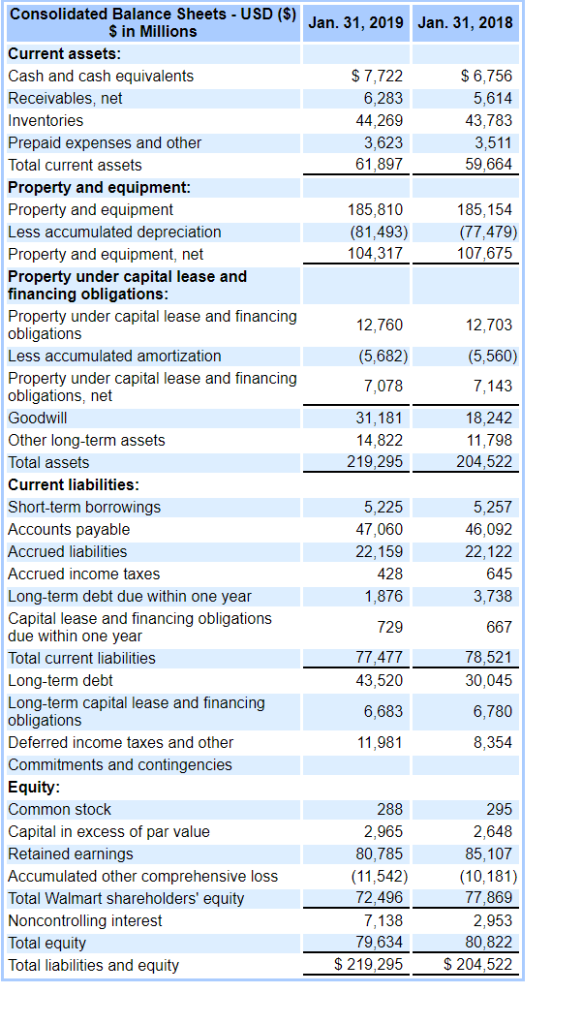
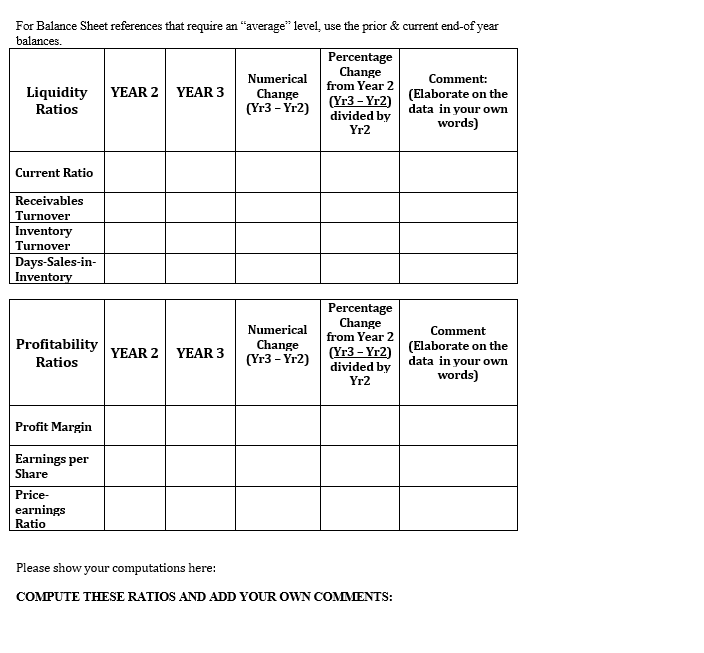
Consolidated Balance Sheets - USD (S) Jan. 31. 2019 Jan. 31, 2018 in Millions Current assets $7,722 $6,756 Cash and cash equivalents Receivables, net 6,283 5,614 Inventories 44,269 43,783 Prepaid expenses and other Total current assets 3,623 61,897 3,511 59,664 Property and equipment: Property and equipment 185,810 185,154 (81,493) 104.317 (77,479) 107,675 Less accumulated depreciation Property and equipment, net Property under capital lease and financing obligations: Property under capital lease and financing obligations 12,760 12,703 (5,682) Less accumulated amortization (5,560) Property under capital lease and financing obligations, net Goodwill 7,078 7,143 31,181 18,242 Other long-term assets 14,822 219,295 11,798 204,522 Total assets Current liabilities: Short-term borrowings Accounts payable 5,225 5,257 47,060 46,092 Accrued liabilities 22,159 22,122 Accrued income taxes 428 645 Long-term debt due within one year 1,876 3,738 Capital lease and financing obligations due within one year 729 667 Total current liabilities 77,477 78,521 43,520 30,045 Long-term debt Long-term capital lease and financing obligations 6,683 6,780 Deferred income taxes and other 11,981 8,354 Commitments and contingencies Equity: Common stock 288 295 Capital in excess of par value Retained earnings 2,965 2,648 80,785 85,107 Accumulated other comprehensive loss Total Walmart shareholders' equity (11,542) 72,496 (10,181) 77,869 Noncontrolling interest Total equity Total liabilities and equity 7,138 2,953 79,634 80,822 $204,522 $ 219,295 For Balance Sheet references that require an "average" level use the prior & current end-of year balances. Percentage Change from Year 2 Numerical Change (Yr3 - Yr2) Comment (Elaborate on the data in your own words) YEAR 3 Liquidity Ratios YEAR 2 (Yr3-Yr2) divided by Yr2 Current Ratio Receivables Turnover Inventory Turnover Days-Sales-in Inventory Percentage Change from Year 2 Numerical Comment ProfitabilityYEAR 2 (Yr3-Yr2)(Elaborate on the divided by Change (Yr3-Yr2) YEAR 3 data in your own Ratios words) Yr2 Profit Margin Earnings per Share Price earnings Ratio Please show your computations here: COMPUTE THESE RATIOS AND ADD YOUR OWN COMMENTS: Consolidated Balance Sheets - USD (S) Jan. 31. 2019 Jan. 31, 2018 in Millions Current assets $7,722 $6,756 Cash and cash equivalents Receivables, net 6,283 5,614 Inventories 44,269 43,783 Prepaid expenses and other Total current assets 3,623 61,897 3,511 59,664 Property and equipment: Property and equipment 185,810 185,154 (81,493) 104.317 (77,479) 107,675 Less accumulated depreciation Property and equipment, net Property under capital lease and financing obligations: Property under capital lease and financing obligations 12,760 12,703 (5,682) Less accumulated amortization (5,560) Property under capital lease and financing obligations, net Goodwill 7,078 7,143 31,181 18,242 Other long-term assets 14,822 219,295 11,798 204,522 Total assets Current liabilities: Short-term borrowings Accounts payable 5,225 5,257 47,060 46,092 Accrued liabilities 22,159 22,122 Accrued income taxes 428 645 Long-term debt due within one year 1,876 3,738 Capital lease and financing obligations due within one year 729 667 Total current liabilities 77,477 78,521 43,520 30,045 Long-term debt Long-term capital lease and financing obligations 6,683 6,780 Deferred income taxes and other 11,981 8,354 Commitments and contingencies Equity: Common stock 288 295 Capital in excess of par value Retained earnings 2,965 2,648 80,785 85,107 Accumulated other comprehensive loss Total Walmart shareholders' equity (11,542) 72,496 (10,181) 77,869 Noncontrolling interest Total equity Total liabilities and equity 7,138 2,953 79,634 80,822 $204,522 $ 219,295 For Balance Sheet references that require an "average" level use the prior & current end-of year balances. Percentage Change from Year 2 Numerical Change (Yr3 - Yr2) Comment (Elaborate on the data in your own words) YEAR 3 Liquidity Ratios YEAR 2 (Yr3-Yr2) divided by Yr2 Current Ratio Receivables Turnover Inventory Turnover Days-Sales-in Inventory Percentage Change from Year 2 Numerical Comment ProfitabilityYEAR 2 (Yr3-Yr2)(Elaborate on the divided by Change (Yr3-Yr2) YEAR 3 data in your own Ratios words) Yr2 Profit Margin Earnings per Share Price earnings Ratio Please show your computations here: COMPUTE THESE RATIOS AND ADD YOUR OWN COMMENTS