

Question: Create a function to read each colmn of Atmosphere Temperature, Soil Temperature, Atmosphere Humidity and Soil Humidity using the . values method from the numpy
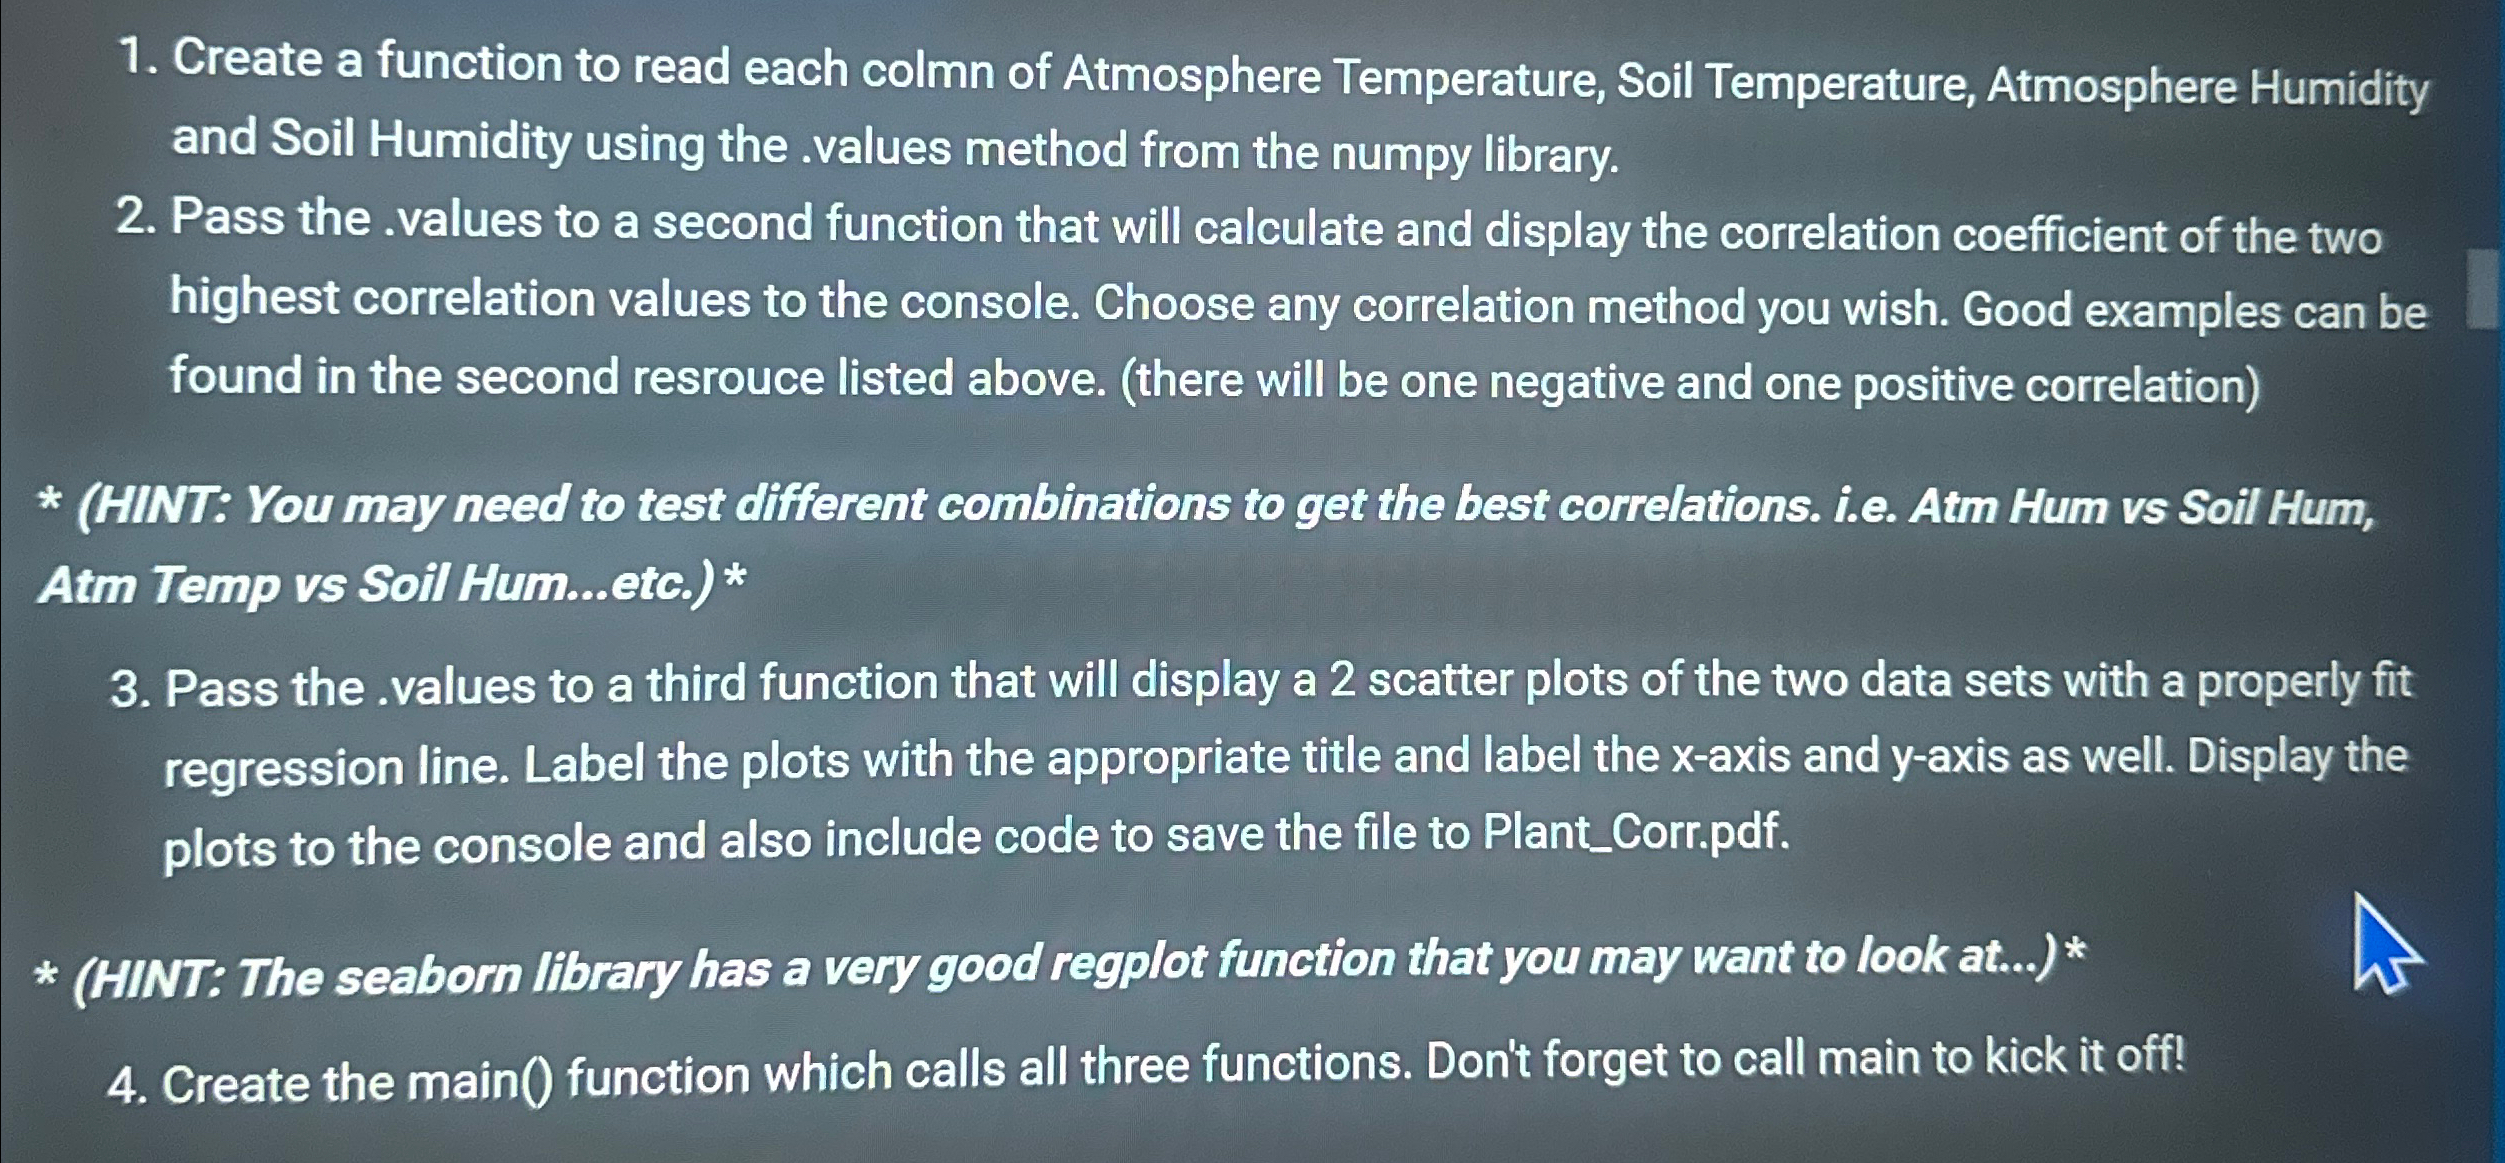
Create a function to read each colmn of Atmosphere Temperature, Soil Temperature, Atmosphere Humidity and Soil Humidity using the values method from the numpy library.
Pass the values to a second function that will calculate and display the correlation coefficient of the two highest correlation values to the console. Choose any correlation method you wish. Good examples can be found in the second resrouce listed above. there will be one negative and one positive correlation
HINT: You may need to test different combinations to get the best correlations. ie Atm Hum vs Soil Hum, Atm Temp vs Soil Hum...etc.
Pass the values to a third function that will display a scatter plots of the two data sets with a properly fit regression line. Label the plots with the appropriate title and label the axis and axis as well. Display the plots to the console and also include code to save the file to PlantCorr.pdf
HINT: The seaborn lfbrary has a very good regplot function that you may want to look at
Create the main function which calls all three functions. Don't forget to call main to kick it off!
Step by Step Solution
There are 3 Steps involved in it
1 Expert Approved Answer
Step: 1 Unlock

Question Has Been Solved by an Expert!
Get step-by-step solutions from verified subject matter experts
Step: 2 Unlock
Step: 3 Unlock