Answered step by step
Verified Expert Solution
Question
1 Approved Answer
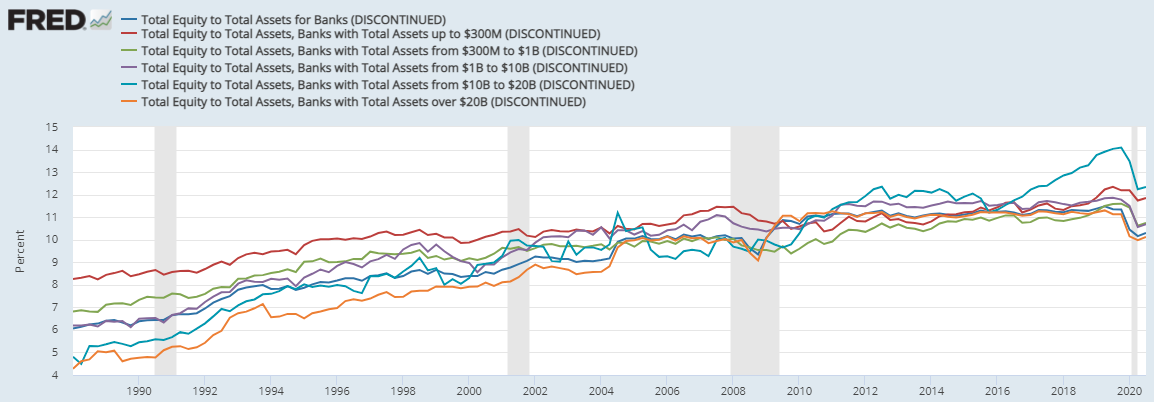
Create a graph comparing Total Equity to Total Assets for the following banks: Total Equity to Total Assets for Banks (EQTA) Total Equity to Total
Create a graph comparing Total Equity to Total Assets for the following banks: Total Equity to Total Assets for Banks (EQTA) Total Equity to Total Assets, Banks with Total Assets Up to $300M Between $300M to $1B Between $1B to $10B Between $10B to $20B Over $20B  a) What does the series "Total Equity to Total Assets" measure?
b) How does the series relate to financial security?
c) Explain the changes in the series over time across bank size?
d) How has the ratio changed following the Great Recession?
FRED Total Equity to Total Assets for Banks (DISCONTINUED) Total Equity to Total Assets, Banks with Total Assets up to $300M (DISCONTINUED) Total Equity to Total Assets, Banks with Total Assets from $300M to $1B (DISCONTINUED) Total Equity to Total Assets, Banks with Total Assets from $1 to $10B (DISCONTINUED) Total Equity to Total Assets, Banks with Total Assets from $10B to $20B (DISCONTINUED) Total Equity to Total Assets, Banks with Total Assets over $20B (DISCONTINUED) 15 14 13 12 11 10 Percent 9 8 7 6 4 1990 1992 1994 1996 1998 2000 2002 2004 2006 2008 2010 2012 2014 2016 2018 2020Step by Step Solution
There are 3 Steps involved in it
Step: 1

Get Instant Access to Expert-Tailored Solutions
See step-by-step solutions with expert insights and AI powered tools for academic success
Step: 2

Step: 3

Ace Your Homework with AI
Get the answers you need in no time with our AI-driven, step-by-step assistance
Get Started


