Answered step by step
Verified Expert Solution
Question
1 Approved Answer
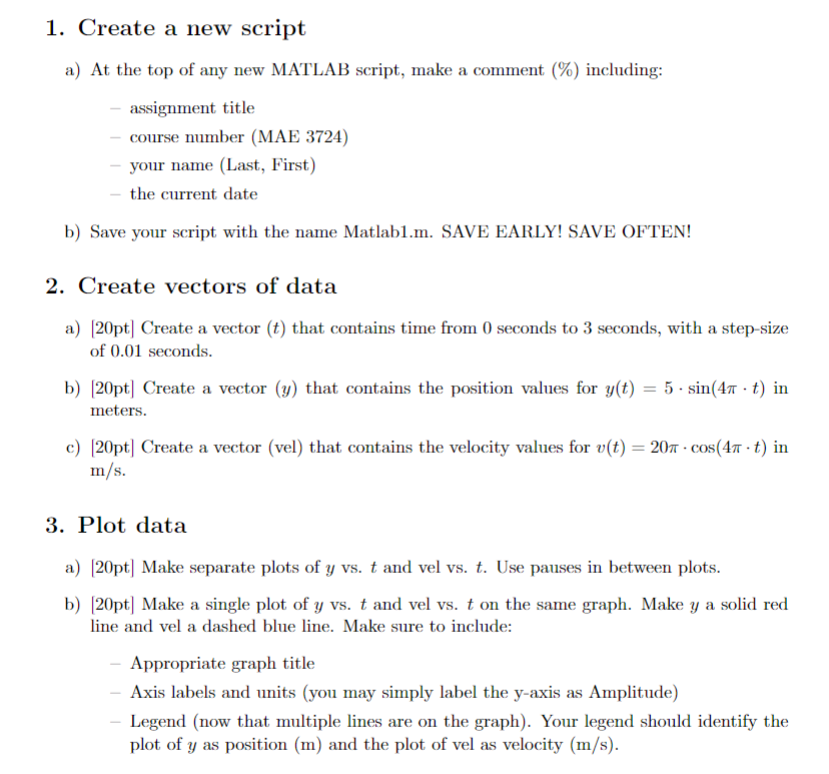
Create a new script a ) At the top of any new MATLAB script, make a comment ( % ) including: assignment title course number
Create a new script
a At the top of any new MATLAB script, make a comment including:
assignment title
course number MAE
your name Last First
the current date
b Save your script with the name Matlabm SAVE EARLY! SAVE OFTEN!
Create vectors of data
apt Create a vector that contains time from seconds to seconds, with a stepsize
of seconds.
b Create a vector that contains the position values for in
meters.
c Create a vector vel that contains the velocity values for in
Plot data
apt Make separate plots of vs and vel vs Use pauses in between plots.
bpt Make a single plot of vs and vel vs on the same graph. Make a solid red
line and vel a dashed blue line. Make sure to include:
Appropriate graph title
Axis labels and units you may simply label the yaxis as Amplitude
Legend now that multiple lines are on the graph Your legend should identify the
plot of as position m and the plot of vel as velocity ms

Step by Step Solution
There are 3 Steps involved in it
Step: 1

Get Instant Access to Expert-Tailored Solutions
See step-by-step solutions with expert insights and AI powered tools for academic success
Step: 2

Step: 3

Ace Your Homework with AI
Get the answers you need in no time with our AI-driven, step-by-step assistance
Get Started


