

Answered step by step
Verified Expert Solution
Question
1 Approved Answer
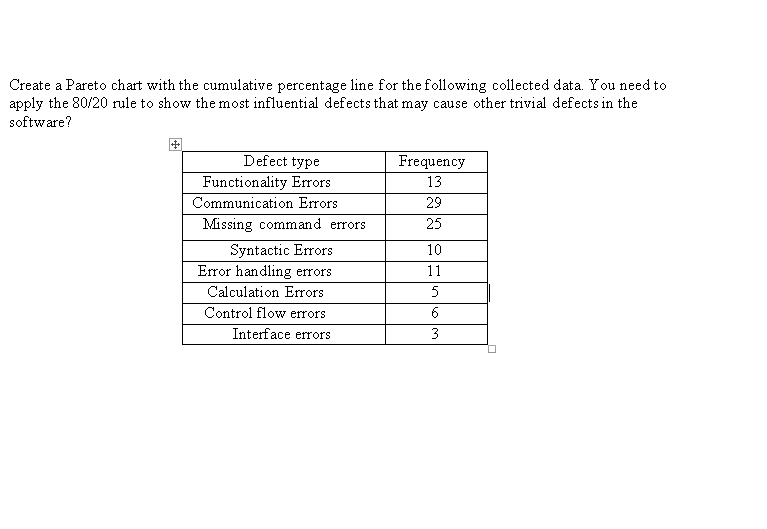
Create a Pareto chart with the cumulative percentage line for the following collected data. You need to apply the 80/20 rule to show the most
Step by Step Solution
There are 3 Steps involved in it
Step: 1

Get Instant Access to Expert-Tailored Solutions
See step-by-step solutions with expert insights and AI powered tools for academic success
Step: 2

Step: 3
Ace Your Homework with AI
Get the answers you need in no time with our AI-driven, step-by-step assistance
Get Started
Oracle PL/SQL Programming Database Management Systems
Authors: Steven Feuerstein
1st Edition
978-1565921429