Answered step by step
Verified Expert Solution
Question
1 Approved Answer
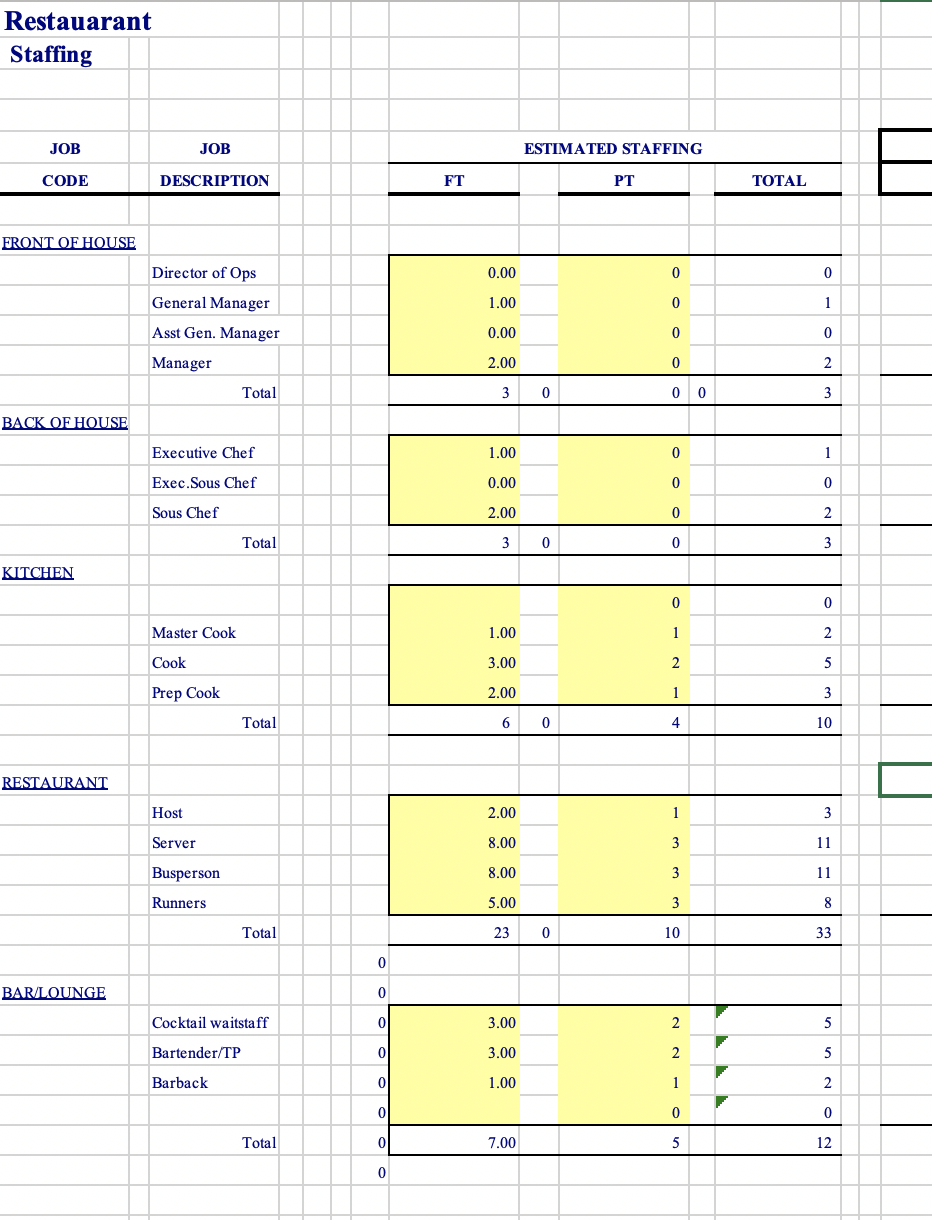
Create demand-based schedule for a dinner restaurant indicating how many people will work per hour for a restaurant. Please provide your assumptions as to why
- Create demand-based schedule for a dinner restaurant indicating how many people will work per hour for a restaurant. Please provide your assumptions as to why you schedule the quantity of people you do for the times you schedule them.
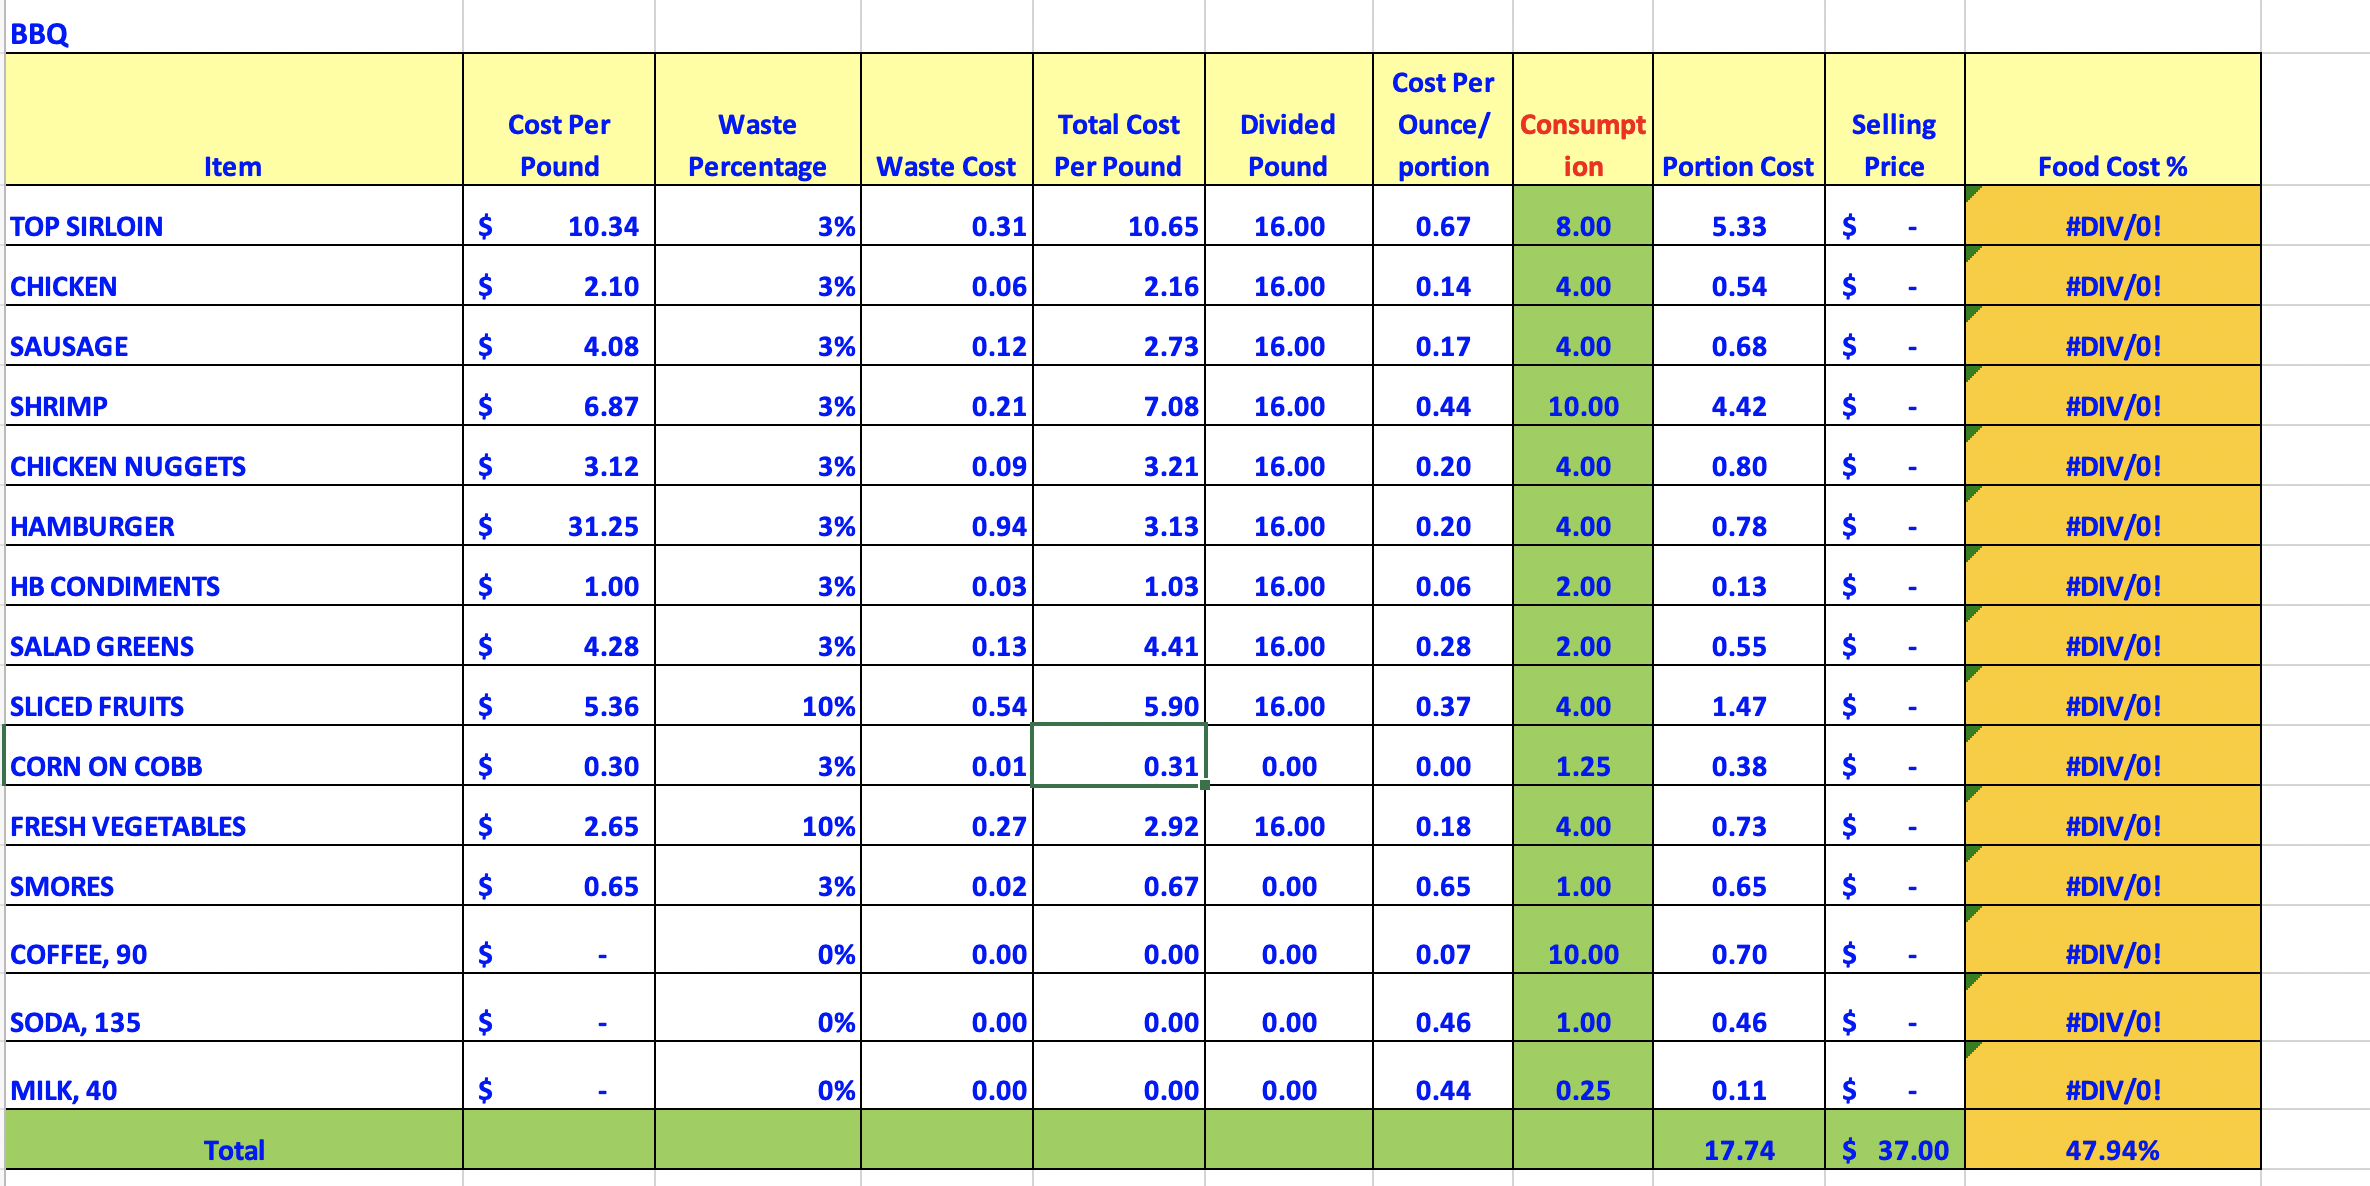
- Using the menu costing examples provided. Create mock menu costing/recipe cost for a cheeseburger meal. Prices do not have to be exact from a grocery store, but your costs need to add up correctly, and based on a sales price, the cost percentage/contribution margin should be accurate.
Demand Based Schedule Assumptions :
Demand Based Schedule Staffing built based on assumptions Cheeseburger meal list of ingredients :
Cheeseburger meal costs per ingredient :
Cheeseburger meal sales price listed :
Cheeseburger meal food cost percentage is accurate :
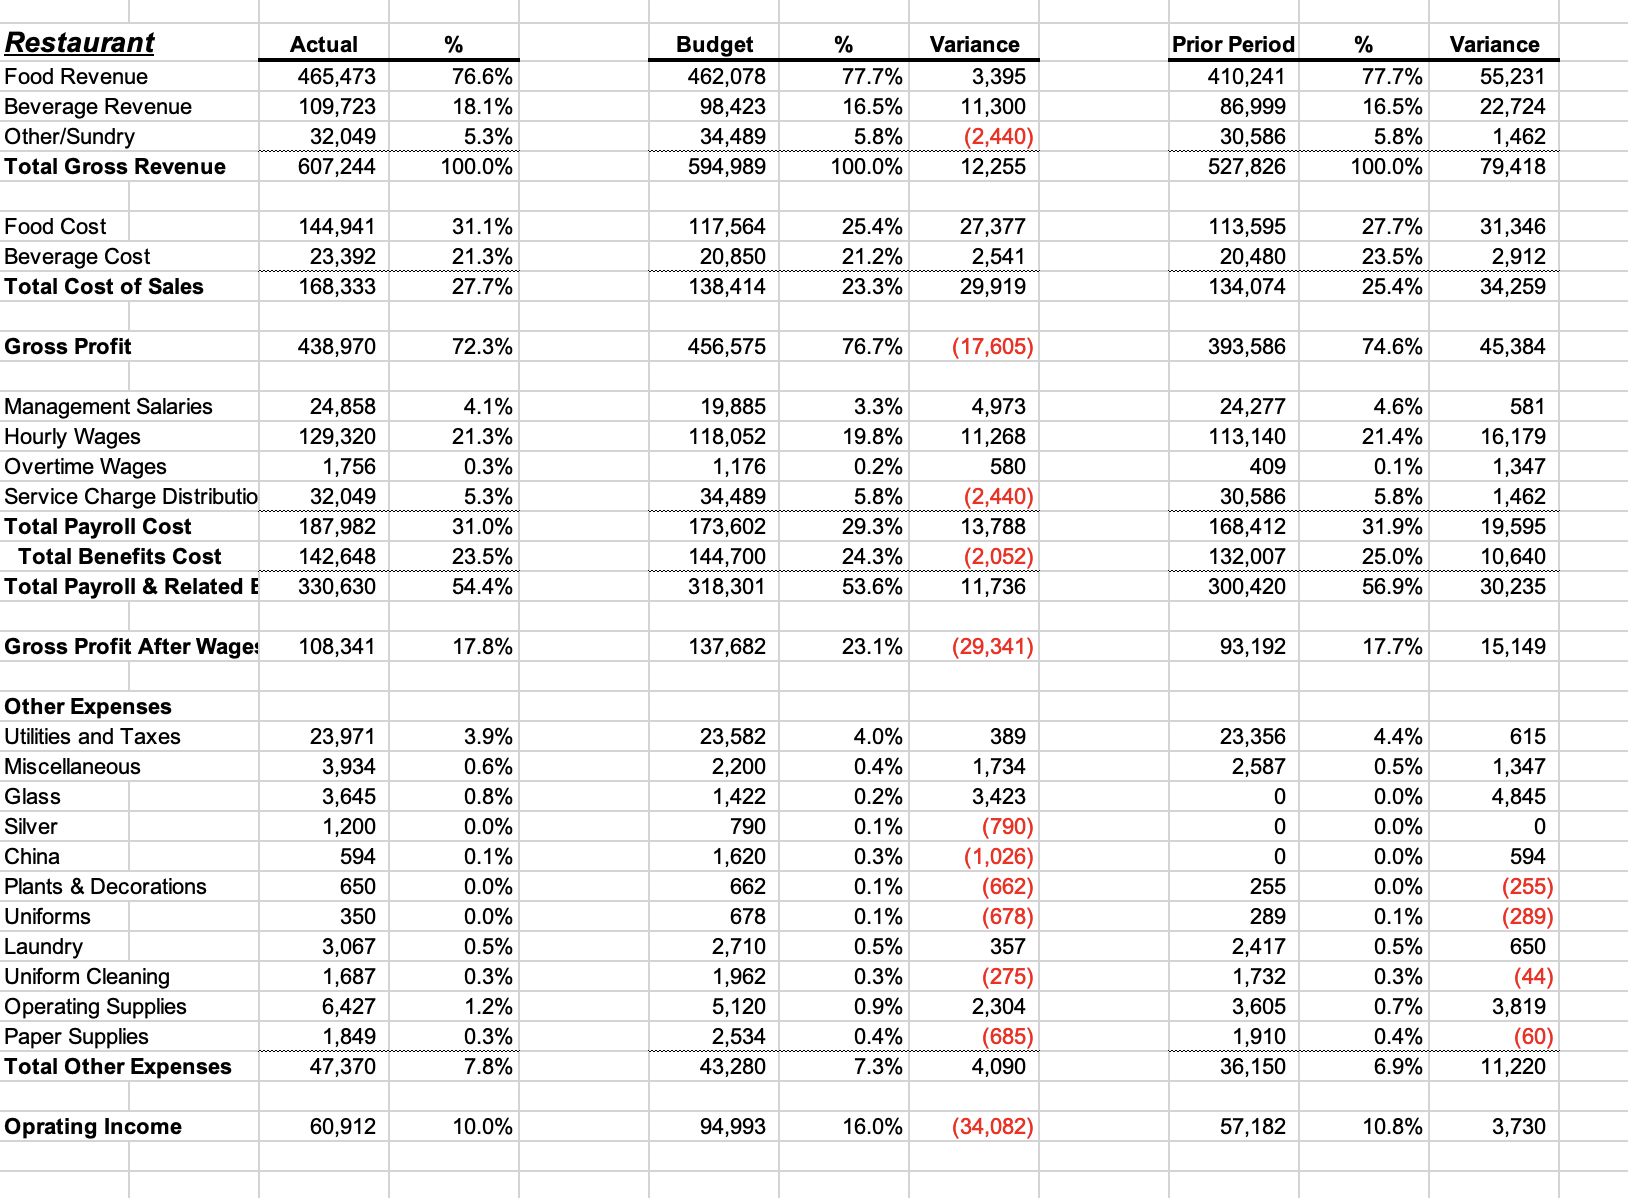
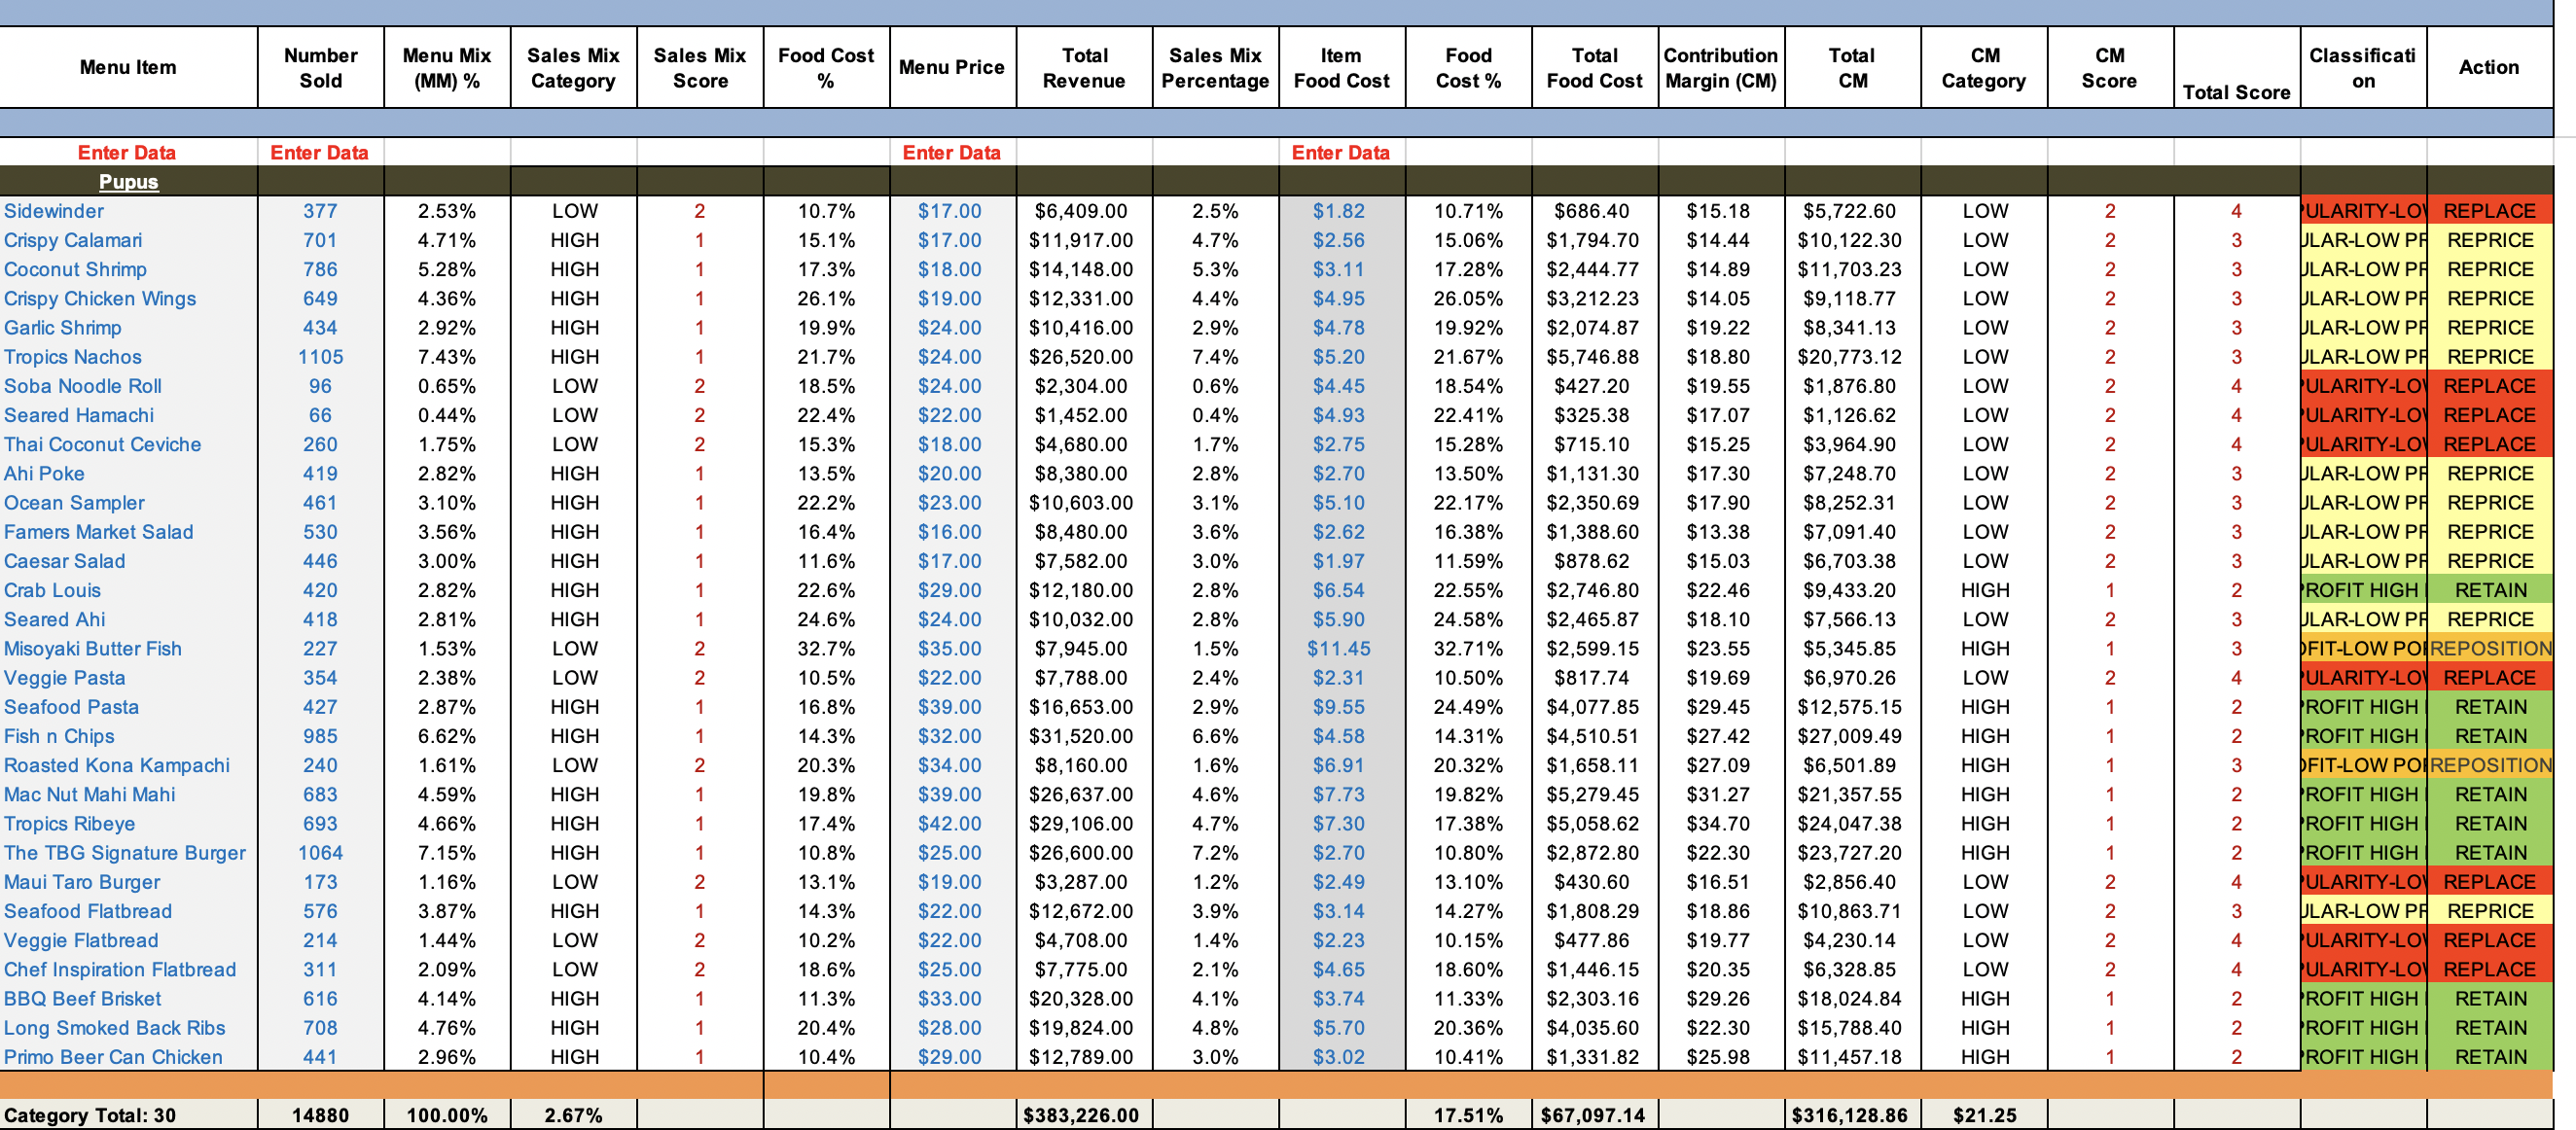
Income statement reviewed for overall condition of operation Income statement recommendations to be more profitable Menu engineering :recommendations provided on menu changes :


Restaurant Food Revenue Actual % Budget % Variance Prior Period % Variance 465,473 76.6% 462,078 77.7% 3,395 410,241 77.7% 55,231 Beverage Revenue 109,723 18.1% 98,423 16.5% 11,300 86,999 16.5% 22,724 Other/Sundry 32,049 5.3% 34,489 5.8% (2,440) 30,586 5.8% 1,462 Total Gross Revenue 607,244 100.0% 594,989 100.0% 12,255 527,826 100.0% 79,418 Food Cost 144,941 31.1% 117,564 25.4% 27,377 113,595 27.7% 31,346 Beverage Cost 23,392 21.3% 20,850 21.2% 2,541 20,480 23.5% 2,912 Total Cost of Sales 168,333 27.7% 138,414 23.3% 29,919 134,074 25.4% 34,259 Gross Profit 438,970 72.3% 456,575 76.7% (17,605) 393,586 74.6% 45,384 Management Salaries 24,858 4.1% 19,885 3.3% 4,973 24,277 4.6% 581 Hourly Wages 129,320 21.3% 118,052 19.8% 11,268 113,140 21.4% 16,179 Overtime Wages 1,756 0.3% 1,176 0.2% 580 409 0.1% 1,347 Service Charge Distributio 32,049 5.3% 34,489 5.8% (2,440) 30,586 5.8% 1,462 Total Payroll Cost 187,982 31.0% 173,602 29.3% 13,788 168,412 31.9% 19,595 Total Benefits Cost 142,648 23.5% 144,700 24.3% (2,052) 132,007 25.0% 10,640 Total Payroll & Related E 330,630 54.4% 318,301 53.6% 11,736 300,420 56.9% 30,235 Gross Profit After Wage: 108,341 17.8% 137,682 23.1% (29,341) 93,192 17.7% 15,149 Other Expenses Utilities and Taxes 23,971 3.9% 23,582 4.0% 389 23,356 4.4% 615 Miscellaneous 3,934 0.6% 2,200 0.4% 1,734 2,587 0.5% 1,347 Glass 3,645 0.8% 1,422 0.2% 3,423 0 0.0% 4,845 Silver 1,200 0.0% 790 0.1% (790) 0 0.0% 0 China 594 0.1% 1,620 0.3% (1,026) 0 0.0% 594 Plants & Decorations 650 0.0% 662 0.1% (662) 255 0.0% (255) Uniforms 350 0.0% 678 0.1% (678) 289 0.1% (289) Laundry 3,067 0.5% 2,710 0.5% 357 2,417 0.5% 650 Uniform Cleaning 1,687 0.3% 1,962 0.3% (275) 1,732 0.3% (44) Operating Supplies 6,427 1.2% 5,120 0.9% 2,304 3,605 0.7% 3,819 Paper Supplies 1,849 0.3% 2,534 0.4% (685) 1,910 0.4% (60) Total Other Expenses 47,370 7.8% 43,280 7.3% 4,090 36,150 6.9% 11,220 Oprating Income 60,912 10.0% 94,993 16.0% (34,082) 57,182 10.8% 3,730
Step by Step Solution
There are 3 Steps involved in it
Step: 1

Get Instant Access to Expert-Tailored Solutions
See step-by-step solutions with expert insights and AI powered tools for academic success
Step: 2

Step: 3

Ace Your Homework with AI
Get the answers you need in no time with our AI-driven, step-by-step assistance
Get Started


