

Question
Creating a Graph in R using the Gather Function!! Create a faceted graph that visualizes the distributions of the total_cases and total_deaths columns. To do
Creating a Graph in R using the Gather Function!!
Create a faceted graph that visualizes the distributions of the total_cases and total_deaths columns. To do this, you will need to:
-
gather() these two columns, and pipe the output dataframe to ggplot() to plot the graph.
-
Facet the graph over the key column that you created with gather().
-
By default the x-axis of each facet will be on the same scale. However, the scale of these two variables is quite different, so me may wish to allow the x-axis range to vary between facets. We can do this with the scales = "free" argument in the faceting function, e.g.
facet_wrap(~..., scales = "free_x")
-
-
Pick a type of graph that is appropriate for visualizing the distribution of a single variable (we have learned about several such graphs - you may pick the one you prefer for this exercise). You will need to plot the value column created by the gather function in these graphs.
-
Remember to label your graph appropriately.
The final faceted figure should contain two sub-plots (one showing the distribution of total_cases, the other showing the distribution of total_deaths).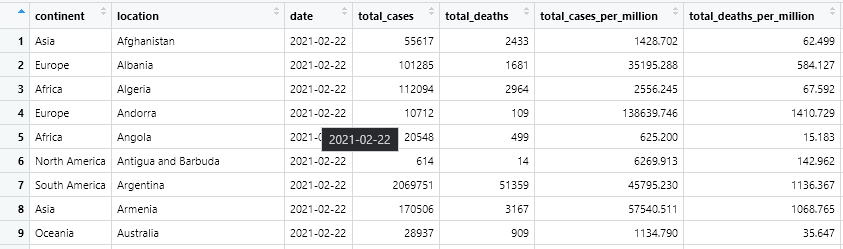
Step by Step Solution
There are 3 Steps involved in it
Step: 1

Get Instant Access to Expert-Tailored Solutions
See step-by-step solutions with expert insights and AI powered tools for academic success
Step: 2

Step: 3
Ace Your Homework with AI
Get the answers you need in no time with our AI-driven, step-by-step assistance
Get Started
Automating Access Databases With Macros
Authors: Fish Davis
1st Edition
1797816349, 978-1797816340