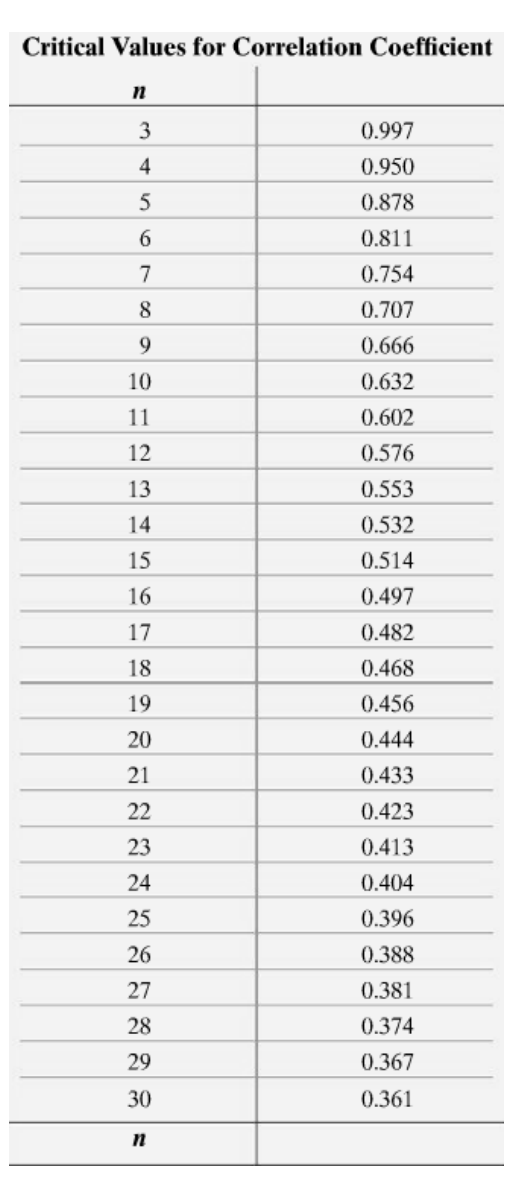
Critical Values for Correlation Coefficient n 0.997 0.950 0.878 O DO - ON UI A W 0.811 0.754 0.707 0.666 10 0.632 11 0.602 12 0.576 13 0.553 14 0.532 15 0.514 16 0.497 17 0.482 18 0.468 19 0.456 20 0.444 21 0.433 22 0.423 23 0.413 24 0.404 25 0.396 26 0.388 27 0.381 28 0.374 29 0.367 30 0.361 nThe accompanying data represent the number of days absent, x, and the final exam score, y, for a sample of college students in a general education course at a large state university. Complete parts (a) through (e) below. Click the icon to view the absence count and final exam score data. Click the icon to view a table of critical values for the correlation coefficient. (a) Find the least-squares regression line treating number of absences as the explanatory variable and the final exam score as the response variable. y = _x+/ - X (Round to three decimal places as needed.) Absences and Final Exam Scores (b) Interpret the slope and the y-intercept, if appropriate. Choose the correct answer below and fill in any answer boxes in your choice. (Round to three decimal places as needed.) No. of O A. For every additional absence, a student's final exam score drops points, on average. The average final exam score of students who miss no classes is. absences, x 0 2 3 4 5 6 7 8 9 Final O B. For every additional absence, a student's final exam score drops points, on average. It is not appropriate to interpret the y-intercept. exam score, y 88.3 85.6 84.1 80.5 78.2 74.4 64.7 72.6 65.1 65.7 O C. The average final exam score of students who miss no classes is . It is not appropriate to interpret the slope. O D. It is not appropriate to interpret the slope or the y-intercept. (c) Predict the final exam score for a student who misses five class periods. y= (Round to two decimal places as needed.) Print Done Compute the residual. (Round to two decimal places as needed.) Is the final exam score above or below average for this number of absences? Above O Below(d) Draw the least-squares regression line on the scatter diagram of the data. Choose the correct graph below. O A. Exam Scores vs. Absences O B. Exam Scores vs. Absences 100- 100- 80- 80-$ Final Exam Score 60- Final Exam Score 60- 40- 40- 20- 20 0 - 0- 2 6 8 10 2 4 6 8 10 Number of Absences Number of Absences O C. Exam Scores vs. Absences O D. Exam Scores vs. Absences 100- 100- 80-$ 80- Final Exam Score 60- Final Exam Score 60 40- 40- 2 10 2 4 6 8 10 Number of Absences Number of Absences (e) Would it be reasonable to use the least-squares regression line to predict the final exam score for a student who has missed 15 class periods? Why or why not? O A. Yes, because the absolute value of the correlation coefficient is greater than the critical value for a sample size of n = 10. O B. No, because 15 absences is outside the scope of the model. O C. No, because the absolute value of the correlation coefficient is less than the critical value for a sample size of n = 10. O D. Yes, because the purpose of finding the regression line is to make predictions outside the scope of the model