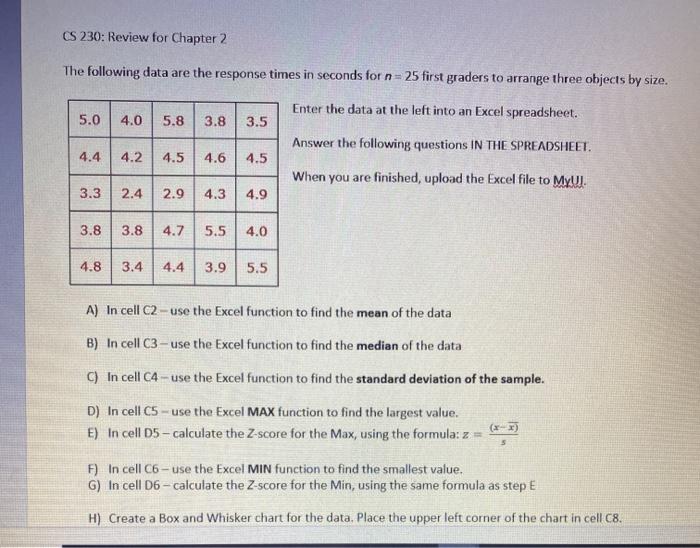
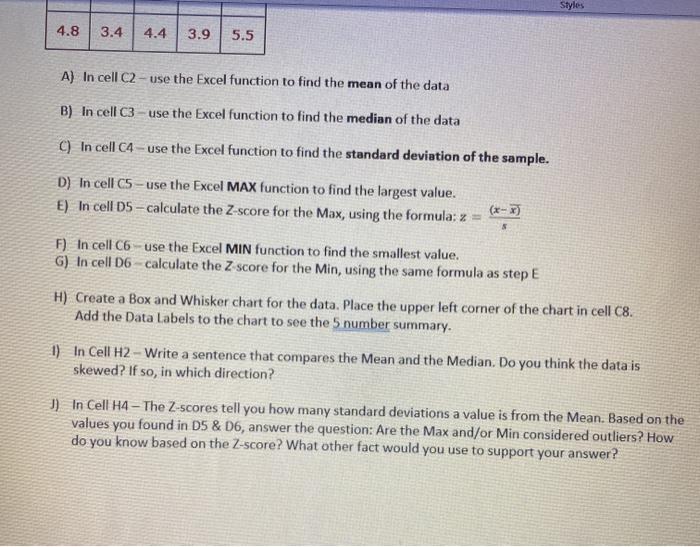
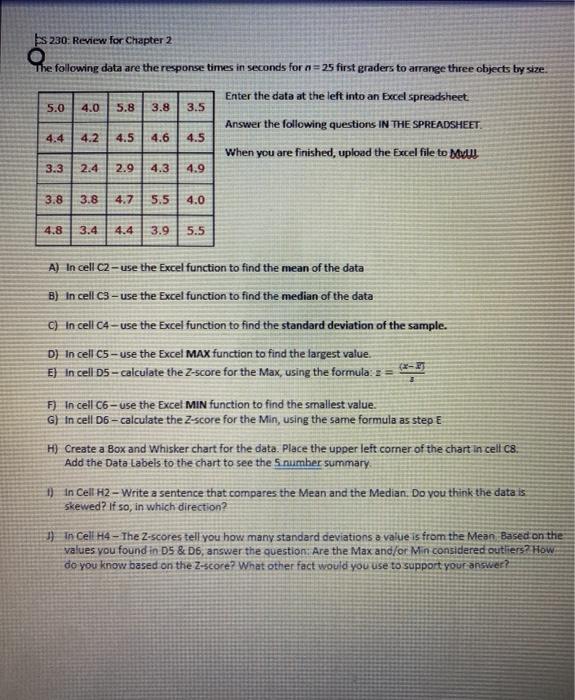
CS 230: Review for Chapter 2 The following data are the response times in seconds for n=25 first graders to arrange three objects by size. Enter the data at the left into an Excel spreadsheet. 5.0 4.0 5.8 3.8 3.5 Answer the following questions IN THE SPREADSHEET. 4.4 4.2 4.5 4.6 4.5 When you are finished, upload the Excel file to MyU. 3.3 2.4 2.9 4.3 4.9 3.8 3.8 4.7 5.5 4.0 4.8 3.4 4.4 3.9 5.5 A) In cell C2 - use the Excel function to find the mean of the data B) In cell C3 - use the Excel function to find the median of the data C) In cell C4 - use the Excel function to find the standard deviation of the sample. D) In cell C5 - use the Excel MAX function to find the largest value. E) In cell D5 - calculate the Z-score for the Max, using the formula: z F) In cell C6-use the Excel MIN function to find the smallest value. G) In cell D6 - calculate the Z-score for the Min, using the same formula as step E H) Create a Box and Whisker chart for the data. Place the upper left corner of the chart in cell C8. Styles 4.8 3.4 4.4 3.9 5.5 A) In cell C2 - use the Excel function to find the mean of the data B) In cell C3 - use the Excel function to find the median of the data C) In cell 04 - use the Excel function to find the standard deviation of the sample. D) In cell C5 - use the Excel MAX function to find the largest value. E) In cell D5 - calculate the Z-score for the Max, using the formula: 2 = 5 F) In cell C6 use the Excel MIN function to find the smallest value. G) In cell D6 calculate the Z score for the Min, using the same formula as step E H) Create a Box and Whisker chart for the data. Place the upper left corner of the chart in cell C8. Add the Data Labels to the chart to see the 5 number summary 1) In Cell H2 - Write a sentence that compares the Mean and the Median. Do you think the data is skewed? If so, in which direction? 1) In Cell H4 - The Z-scores tell you how many standard deviations a value is from the Mean. Based on the values you found in D5 & D6, answer the question: Are the Max and/or Min considered outliers? How do you know based on the Z-score? What other fact would you use to support your answer? s 230 Review for Chapter 2 The following data are the response times in seconds for n=25 first graders to arrange three objects by size. Enter the data at the left into an Excel spreadsheet 5.0 Answer the following questions IN THE SPREADSHEET. 4.4 When you are finished, upload the Excel file to Malu 3.3 2.4 4.3 4.9 4.0 5.8 3.8 3.5 4.2 4.5 4.6 4.5 2.9 3.8 3.8 5.5 4.0 4.8 3.4 4.4 3.9 5.5 A) In cell C2 - use the Excel function to find the mean of the data B) In cell C3 - use the Excel function to find the median of the data C) In cell C4 use the Excel function to find the standard deviation of the sample. D) In cell C5 - use the Excel MAX function to find the largest value. E) In cell D5 - calculate the Z-score for the Max, using the formula: = = F) In cell C6- use the Excel MIN function to find the smallest value. G) in cell D6-calculate the Z-score for the Min, using the same formula as step E H) Create a Box and Whisker chart for the data. Place the upper left corner of the chart in cell cs. Add the Data Labels to the chart to see the Snumber summary 1) In Cell 2 - Write a sentence that compares the Mean and the Median. Do you think the data is skewed? If so, in which direction? ]] in Cell H4 - The Z-scores tell you how many standard deviations a value is from the Mean Based on the values you found in Ds & D6, answer the question: Are the Max and/or Min considered outliers? How do you know based on the Z-score? What other fact would you use to support your