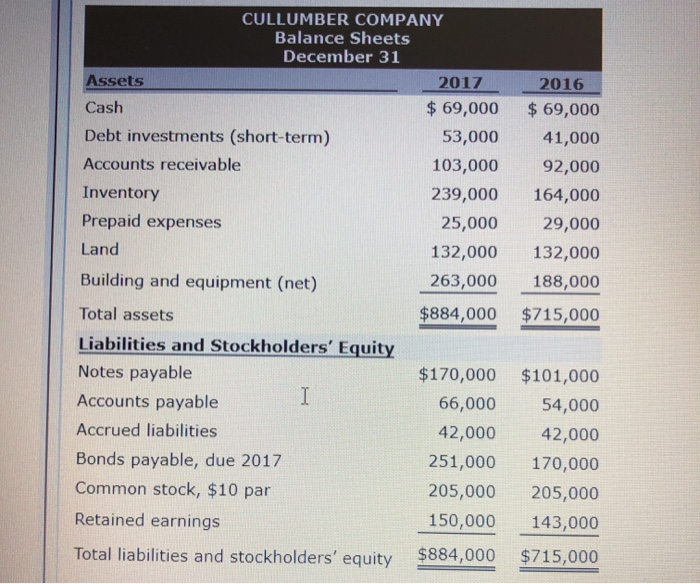
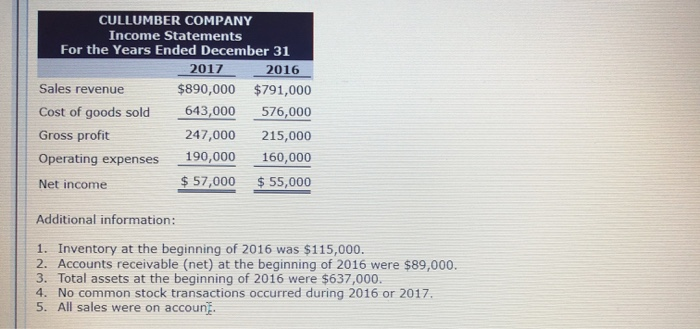
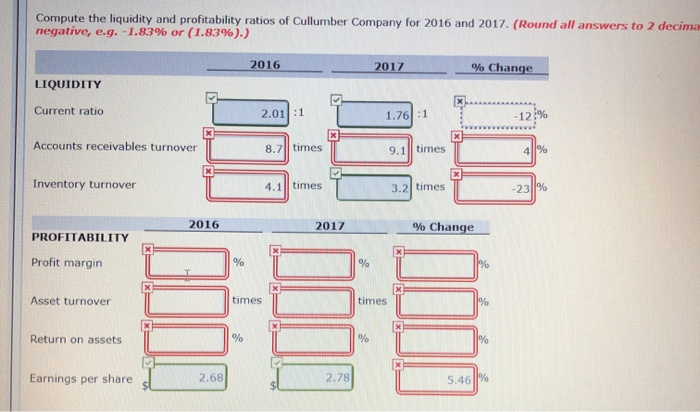
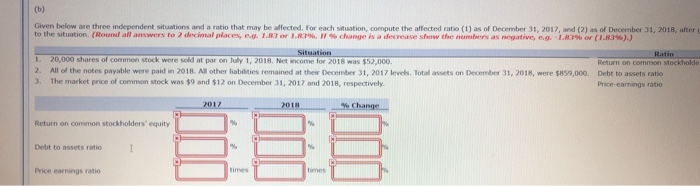
CULLUMBER COMPANY Balance Sheets December 31 Assets Cash Debt investments (short-term) Accounts receivable Inventory Prepaid expenses Land Building and equipment (net) Total assets Liabilities and Stockholders' Equity Notes payable Accounts payable Accrued liabilities Bonds payable, due 2017 Common stock, $10 par Retained earnings 2017 2016 69,000 69,000 41,000 103,000 92,000 239,000 164,000 25,000 29,000 132,000 132,000 263,000 188,000 $884,000 $715,000 53,000 $170,000 $101,000 66,000 54,000 42,000 251,000 170,000 205,000 205,000 150,000 143,000 Total liabilities and stockholders' equity $884,000 $715,000 42,000 CULLUMBER COMPANY Income Statements For the Years Ended December 31 2017 2016 Sales revenue Cost of goods sold Gross profit $890,000 $791,000 643,000 576,000 247,000 215,000 Operating expenses 190,000 160,000 Net income $57,000 $55,000 Additional information: 1. Inventory at the beginning of 2016 was $115,000. 2. Accounts receivable (net) at the beginning of 2016 were $89,000. 3. Total assets at the beginning of 2016 were $637,000. 4. No common stock transactions occurred during 2016 or 2017 5. All sales were on accoun.. Compute the liquidity and profitability ratios of Cullumber Company for 2016 and 2017. (Round all answers to 2 decima negative, e.g.-1.83%) or (1.83%).) 2016 2017 % Change LIQUIDITY Current ratio 2.01 :1 8.7 times 4.1 times 1.76:1 -12)% Accounts receivables turnover 9.1 times 4 Inventory turnover 3.2 times 2016 % Change 2017 PROFITABILITY Profit margin Asset turnover times times Return on assets 2.68 2.78 Earnings per share s Given below are three independent situations and a ratio that may be affected. For each situsation, compute the affected ratio (1) as of December 31, 2017, and (2) as of Decernber 31, 2018, after c to the situation. (Round all answers to 2 decinal places, ea 1.83 or 1 ar% " %hange is a decrease show the numbers as negative, ea, rare or 1.83% 1. 20,000 shares of common stock were sold at par on Jully 1, 2018. Net income for 2018 was $52,000. 2. All of the notes payable were paid n 2018. All other liabates remained at ther December 3, 2017 levels Total assets on December 31, 2018. re ses,00 Dett to assets ratio 3. The market price of common stock was $9 and $12 on December 31, 2017 and 2018, respectively Price -earnings ratico Return on common stockholders' equity Debt to assets ratio Price earnings ratio