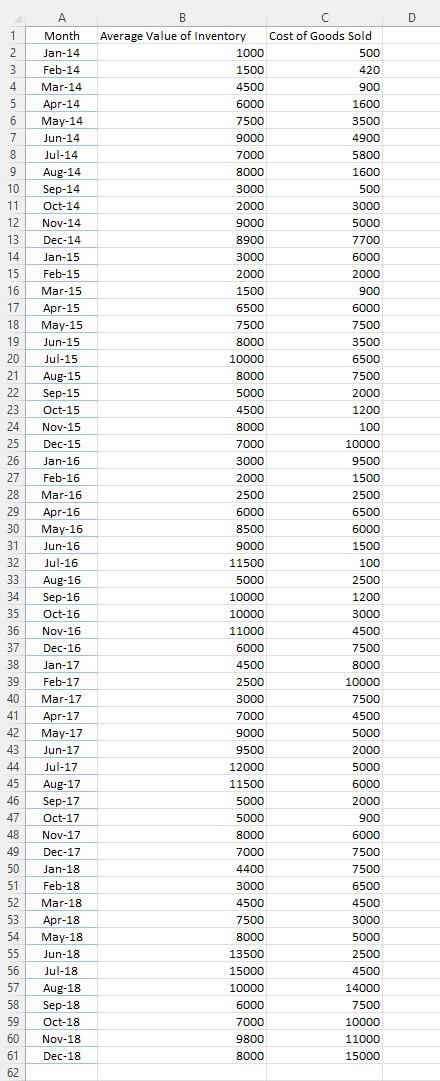
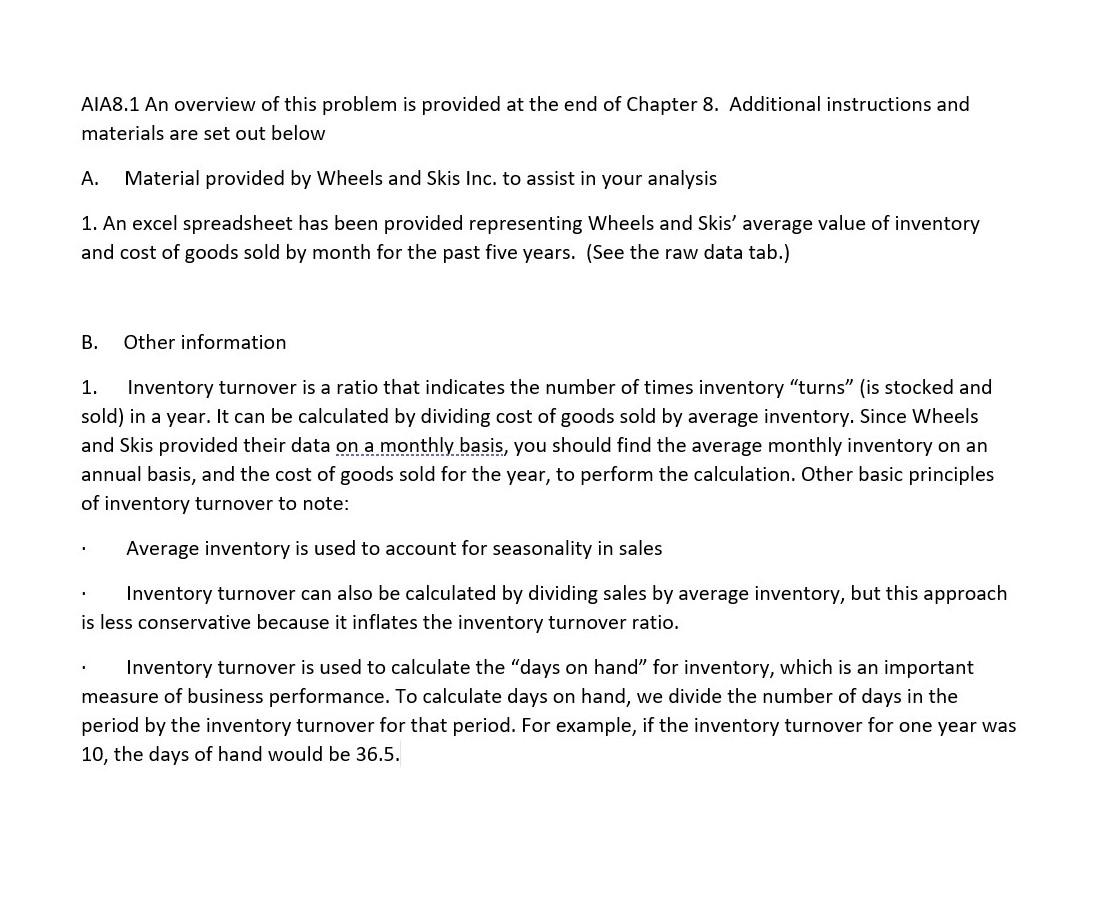
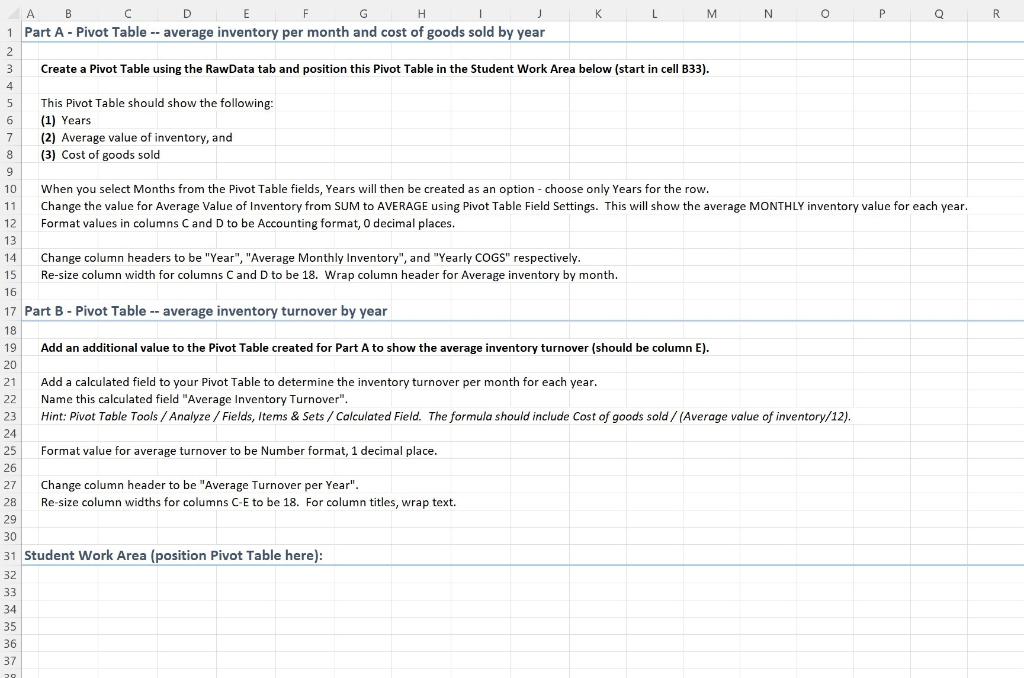
D 1 2 3 4 5 6 7 8 9 10 11 12 13 14 15 16 17 18 19 20 21 22 23 24 25 26 27 28 29 30 A Month Jan-14 Feb-14 Mar-14 Apr-14 May-14 Jun-14 Jul-14 Aug-14 Sep-14 Oct-14 Nov-14 Dec-14 Jan-15 Feb-15 Mar-15 Apr-15 May-15 Jun-15 Jul-15 Aug-15 Sep-15 Oct-15 Nov-15 Dec-15 Jan-16 Feb-16 Mar-16 Apr-16 May-16 Jun-16 Jul-16 Aug-16 Sep-16 Oct-16 Nov-16 Dec-16 Jan-17 Feb-17 Mar-17 Apr-17 May-17 Jun-17 Jul-17 Aug-17 Sep-17 Oct-17 Nov-17 Dec-17 Jan-18 Feb-18 Mar-18 Apr-18 May-18 Jun-18 Jul-18 Aug-18 Sep-18 Oct-18 Nov-18 Dec-18 B C Average Value of Inventory Cost of Goods Sold 1000 500 1500 420 4500 900 6000 1600 7500 3500 9000 4900 7000 5800 8000 1600 3000 500 2000 3000 9000 5000 8900 7700 3000 6000 2000 2000 1500 900 6500 6000 7500 7500 8000 3500 10000 6500 8000 7500 5000 2000 4500 1200 8000 100 7000 10000 3000 9500 2000 1500 2500 2500 6000 6500 8500 6000 9000 1500 11500 100 5000 2500 10000 1200 10000 3000 11000 4500 6000 7500 4500 8000 2500 10000 3000 7500 7000 4500 9000 5000 9500 2000 12000 5000 11500 6000 5000 2000 5000 900 8000 6000 7000 7500 4400 7500 3000 6500 4500 4500 7500 8000 5000 13500 2500 15000 4500 10000 14000 6000 7500 7000 10000 9800 11000 8000 15000 31 32 33 34 35 36 37 38 39 40 41 42 43 44 45 46 47 48 49 50 51 52 53 54 55 56 57 58 59 3000 60 61 62 AIA8.1 An overview of this problem is provided at the end of Chapter 8. Additional instructions and materials are set out below A. Material provided by Wheels and Skis Inc. to assist in your analysis 1. An excel spreadsheet has been provided representing Wheels and Skis' average value of inventory and cost of goods sold by month for the past five years. (See the raw data tab.) B. Other information 1. Inventory turnover is a ratio that indicates the number of times inventory "turns" (is stocked and sold) in a year. It can be calculated by dividing cost of goods sold by average inventory. Since Wheels and Skis provided their data on a monthly basis, you should find the average monthly inventory on an annual basis, and the cost of goods sold for the year, to perform the calculation. Other basic principles of inventory turnover to note: . Average inventory is used to account for seasonality in sales Inventory turnover can also be calculated by dividing sales by average inventory, but this approach is less conservative because it inflates the inventory turnover ratio. . Inventory turnover is used to calculate the "days on hand for inventory, which is an important measure of business performance. To calculate days on hand, we divide the number of days in the period by the inventory turnover for that period. For example, if the inventory turnover for one year was 10, the days of hand would be 36.5. G H 1 K M N 0 P R 8 F H. J L Q Part A - Pivot Table -- average inventory per month and cost of goods sold by year 2 3 Create a Pivot Table using the RawData tab and position this Pivot Table in the Student Work Area below (start in cell B33). 4 4 5 5 This Pivot Table should show the following: 6 (1) Years 7 (2) Average value of inventory, and (3) Cost of goods sold 9 10 When you select Months from the Pivot Table fields, Years will then be created as an option - choose only Years for the row. 11 Change the value for Average Value of Inventory from SUM to AVERAGE using Pivot Table Field Settings. This will show the average MONTHLY inventory value for each year. 12 Format values in columns Cand D to be Accounting format, o decimal places. 13 14 Change column headers to be "Year", "Average Monthly Inventory", and "Yearly COGS" respectively. 15 Re-size column width for columns C and D to be 18. Wrap column header for Average inventory by month. 16 17 Part B - Pivot Table -- average inventory turnover by year 18 19 Add an additional value to the Pivot Table created for Part A to show the average inventory turnover (should be column E). 20 Add a calculated field to your Pivot Table to determine the inventory turnover per month for each year. Name this calculated field "Average Inventory Turnover". 23 Hint: Pivot Table Tools / Analyze / Fields, Items & Sets / Calculated field. The formula should include Cost of goods sold / (Average value of inventory/12). 24 25 Format value for average turnover to be Number format, 1 decimal place. 26 27 Change column header to be "Average Turnover per Year". 28 Re-size column widths for columns C-E to be 18. For column titles, wrap text. 29 30 31 Student Work Area (position Pivot Table here): 32 21 22 33 34 35 36 37 20 A B D E H K L M M N O O P Q R 5 1 Part C-Pivot Column Chart -- create a pivot column chart showing the average inventory turnover for the past 5 years. 2 3 Select and copy the pivot chart created in Part B and paste in student work area below. 4 5 You need to modify the Pivot Table required in order to create the necessary pivot chart using only the average inventory turnover. 6 6 Click on the checkmarks for both Average Value of Inventory and Cost of Goods Sold to remove them from the values in the Pivot Table. 7 8 This Pivot Table should now show the following: 9 9 (1) Years 10 (2) Average inventory turnover 11 12 Re-size column width for column C to be 18, if required. 13 14 After completing the Pivot Table in the student work area, use it to create a Pivot Chart, Clustered Column Chart and position this chart in the space below. 15 16 Format Chart Area: 17 Provide an appropriate chart title, such as "Average Turnover by Year for the Past 5 Years", and change font to 14. 18 Hide all field buttons. 19 Remove legend. 20 Change style to Style 5. 21 22 Part D - What information does this visualization tell you about turnover over the past 5 years? 23 24 25 26 27 28 29 30 31 32 33 Student Work Area (position Pivot Table here): 34 35 36 37 29 A M T 16 B D H 1 1 K N o P Q R S 1 Part E-Pivot Line Chart -- Create a line chart showing the cost of goods sold vs. inventory for the past year. 2 3 Select and copy the pivot chart created in Part B and paste in student work area below. 4 5 5 You need to modify the Pivot Table required in order to create the necessary pivot chart using average value of inventory and cost of goods sold. 6 Click on the checkmark for Average Inventory Turnover to remove this field from the values in the Pivot lable. 7 Add Months to the rows below Years. 8 8 9 This Pivot Table should now show the following: 10 (1) Years 11 (2) Months 12 (3) Average inventory turnover 13 (4) Cost of Goods Sold 14 15 Using the Filter button for Year, ensure the Sclect field is set to Years and filer to show only 2018, Expand the year 2018 ta show all months in the row. 17 Change the value for Average Value of Inventory from AVERAGE to SUM using Pivot Table Field Settings. This will not change the average inventory value for each month but will change the total amount for the year. 18 Re-size value column widths to 18. 19 20 After completing the Pivot Table in the student work area, use it to create a Pivot Chart, Line Chart and position this chart in the space below. 21 22 Format Chart Area: 23 Provide an appropriate chart title - such as "Average Inventory vs. COGS by Month for 2018" 24 Hide all field buttons. 25 Move the legend to the bottom 26 Change style to Style 4. 27 28 Part F - What information does this visualization tell you about monthly sales and inventory levels? 29 30 31 32 33 34 35 36 37 38 39 Student Work Area (position Plvot Table here): 40 41 D K L M N C E F G H J Part G - How can this exercise help Wheels and skis to better manage inventories? 1 2. 3 4. 5 6 7 8 9 10 11 12 13 14 15 D 1 2 3 4 5 6 7 8 9 10 11 12 13 14 15 16 17 18 19 20 21 22 23 24 25 26 27 28 29 30 A Month Jan-14 Feb-14 Mar-14 Apr-14 May-14 Jun-14 Jul-14 Aug-14 Sep-14 Oct-14 Nov-14 Dec-14 Jan-15 Feb-15 Mar-15 Apr-15 May-15 Jun-15 Jul-15 Aug-15 Sep-15 Oct-15 Nov-15 Dec-15 Jan-16 Feb-16 Mar-16 Apr-16 May-16 Jun-16 Jul-16 Aug-16 Sep-16 Oct-16 Nov-16 Dec-16 Jan-17 Feb-17 Mar-17 Apr-17 May-17 Jun-17 Jul-17 Aug-17 Sep-17 Oct-17 Nov-17 Dec-17 Jan-18 Feb-18 Mar-18 Apr-18 May-18 Jun-18 Jul-18 Aug-18 Sep-18 Oct-18 Nov-18 Dec-18 B C Average Value of Inventory Cost of Goods Sold 1000 500 1500 420 4500 900 6000 1600 7500 3500 9000 4900 7000 5800 8000 1600 3000 500 2000 3000 9000 5000 8900 7700 3000 6000 2000 2000 1500 900 6500 6000 7500 7500 8000 3500 10000 6500 8000 7500 5000 2000 4500 1200 8000 100 7000 10000 3000 9500 2000 1500 2500 2500 6000 6500 8500 6000 9000 1500 11500 100 5000 2500 10000 1200 10000 3000 11000 4500 6000 7500 4500 8000 2500 10000 3000 7500 7000 4500 9000 5000 9500 2000 12000 5000 11500 6000 5000 2000 5000 900 8000 6000 7000 7500 4400 7500 3000 6500 4500 4500 7500 8000 5000 13500 2500 15000 4500 10000 14000 6000 7500 7000 10000 9800 11000 8000 15000 31 32 33 34 35 36 37 38 39 40 41 42 43 44 45 46 47 48 49 50 51 52 53 54 55 56 57 58 59 3000 60 61 62 AIA8.1 An overview of this problem is provided at the end of Chapter 8. Additional instructions and materials are set out below A. Material provided by Wheels and Skis Inc. to assist in your analysis 1. An excel spreadsheet has been provided representing Wheels and Skis' average value of inventory and cost of goods sold by month for the past five years. (See the raw data tab.) B. Other information 1. Inventory turnover is a ratio that indicates the number of times inventory "turns" (is stocked and sold) in a year. It can be calculated by dividing cost of goods sold by average inventory. Since Wheels and Skis provided their data on a monthly basis, you should find the average monthly inventory on an annual basis, and the cost of goods sold for the year, to perform the calculation. Other basic principles of inventory turnover to note: . Average inventory is used to account for seasonality in sales Inventory turnover can also be calculated by dividing sales by average inventory, but this approach is less conservative because it inflates the inventory turnover ratio. . Inventory turnover is used to calculate the "days on hand for inventory, which is an important measure of business performance. To calculate days on hand, we divide the number of days in the period by the inventory turnover for that period. For example, if the inventory turnover for one year was 10, the days of hand would be 36.5. G H 1 K M N 0 P R 8 F H. J L Q Part A - Pivot Table -- average inventory per month and cost of goods sold by year 2 3 Create a Pivot Table using the RawData tab and position this Pivot Table in the Student Work Area below (start in cell B33). 4 4 5 5 This Pivot Table should show the following: 6 (1) Years 7 (2) Average value of inventory, and (3) Cost of goods sold 9 10 When you select Months from the Pivot Table fields, Years will then be created as an option - choose only Years for the row. 11 Change the value for Average Value of Inventory from SUM to AVERAGE using Pivot Table Field Settings. This will show the average MONTHLY inventory value for each year. 12 Format values in columns Cand D to be Accounting format, o decimal places. 13 14 Change column headers to be "Year", "Average Monthly Inventory", and "Yearly COGS" respectively. 15 Re-size column width for columns C and D to be 18. Wrap column header for Average inventory by month. 16 17 Part B - Pivot Table -- average inventory turnover by year 18 19 Add an additional value to the Pivot Table created for Part A to show the average inventory turnover (should be column E). 20 Add a calculated field to your Pivot Table to determine the inventory turnover per month for each year. Name this calculated field "Average Inventory Turnover". 23 Hint: Pivot Table Tools / Analyze / Fields, Items & Sets / Calculated field. The formula should include Cost of goods sold / (Average value of inventory/12). 24 25 Format value for average turnover to be Number format, 1 decimal place. 26 27 Change column header to be "Average Turnover per Year". 28 Re-size column widths for columns C-E to be 18. For column titles, wrap text. 29 30 31 Student Work Area (position Pivot Table here): 32 21 22 33 34 35 36 37 20 A B D E H K L M M N O O P Q R 5 1 Part C-Pivot Column Chart -- create a pivot column chart showing the average inventory turnover for the past 5 years. 2 3 Select and copy the pivot chart created in Part B and paste in student work area below. 4 5 You need to modify the Pivot Table required in order to create the necessary pivot chart using only the average inventory turnover. 6 6 Click on the checkmarks for both Average Value of Inventory and Cost of Goods Sold to remove them from the values in the Pivot Table. 7 8 This Pivot Table should now show the following: 9 9 (1) Years 10 (2) Average inventory turnover 11 12 Re-size column width for column C to be 18, if required. 13 14 After completing the Pivot Table in the student work area, use it to create a Pivot Chart, Clustered Column Chart and position this chart in the space below. 15 16 Format Chart Area: 17 Provide an appropriate chart title, such as "Average Turnover by Year for the Past 5 Years", and change font to 14. 18 Hide all field buttons. 19 Remove legend. 20 Change style to Style 5. 21 22 Part D - What information does this visualization tell you about turnover over the past 5 years? 23 24 25 26 27 28 29 30 31 32 33 Student Work Area (position Pivot Table here): 34 35 36 37 29 A M T 16 B D H 1 1 K N o P Q R S 1 Part E-Pivot Line Chart -- Create a line chart showing the cost of goods sold vs. inventory for the past year. 2 3 Select and copy the pivot chart created in Part B and paste in student work area below. 4 5 5 You need to modify the Pivot Table required in order to create the necessary pivot chart using average value of inventory and cost of goods sold. 6 Click on the checkmark for Average Inventory Turnover to remove this field from the values in the Pivot lable. 7 Add Months to the rows below Years. 8 8 9 This Pivot Table should now show the following: 10 (1) Years 11 (2) Months 12 (3) Average inventory turnover 13 (4) Cost of Goods Sold 14 15 Using the Filter button for Year, ensure the Sclect field is set to Years and filer to show only 2018, Expand the year 2018 ta show all months in the row. 17 Change the value for Average Value of Inventory from AVERAGE to SUM using Pivot Table Field Settings. This will not change the average inventory value for each month but will change the total amount for the year. 18 Re-size value column widths to 18. 19 20 After completing the Pivot Table in the student work area, use it to create a Pivot Chart, Line Chart and position this chart in the space below. 21 22 Format Chart Area: 23 Provide an appropriate chart title - such as "Average Inventory vs. COGS by Month for 2018" 24 Hide all field buttons. 25 Move the legend to the bottom 26 Change style to Style 4. 27 28 Part F - What information does this visualization tell you about monthly sales and inventory levels? 29 30 31 32 33 34 35 36 37 38 39 Student Work Area (position Plvot Table here): 40 41 D K L M N C E F G H J Part G - How can this exercise help Wheels and skis to better manage inventories? 1 2. 3 4. 5 6 7 8 9 10 11 12 13 14 15