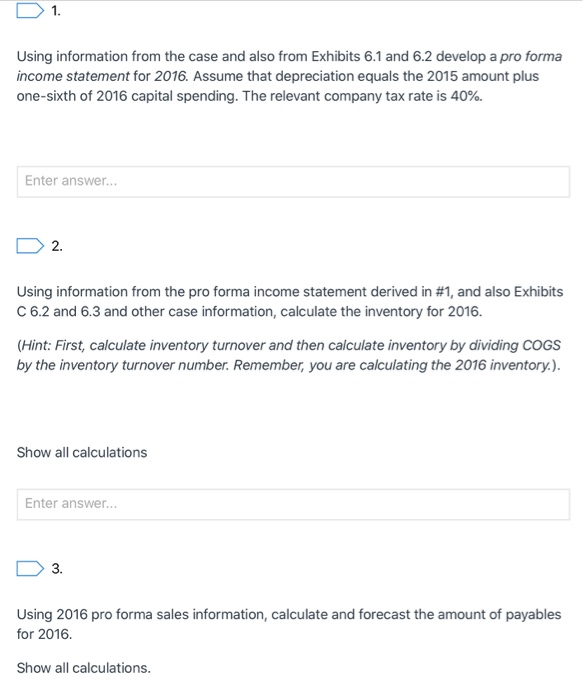
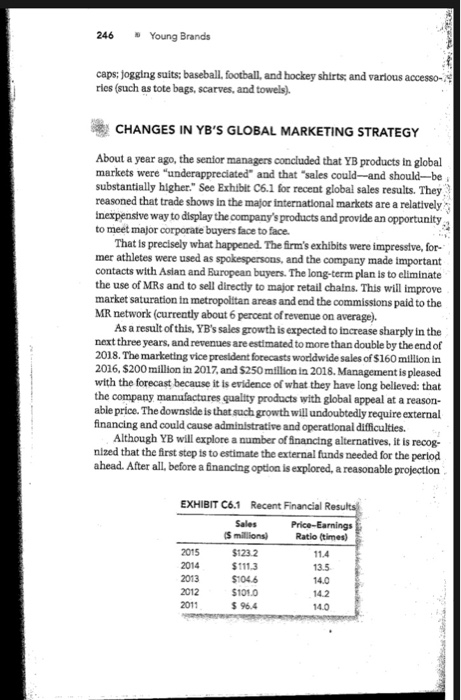
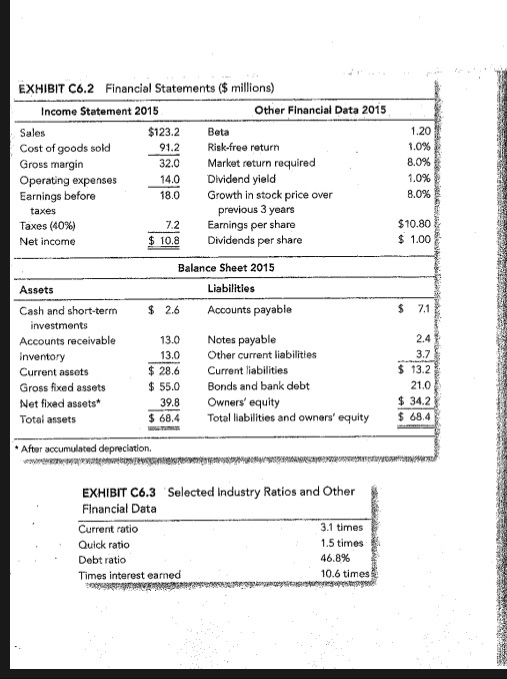
D 1. Using information from the case and also from Exhibits 6.1 and 6.2 develop a pro forma income statement for 2016. Assume that depreciation equals the 2015 amount plus one-sixth of 2016 capital spending. The relevant company tax rate is 40%. Enter answer... D 2. Using information from the pro forma income statement derived in #1, and also Exhibits C 6.2 and 6.3 and other case information, calculate the inventory for 2016. (Hint: First, calculate inventory turnover and then calculate inventory by dividing COGS by the inventory turnover number. Remember, you are calculating the 2016 inventory.). Show all calculations Enter answer... D 3. Using 2016 pro forma sales information, calculate and forecast the amount of payables for 2016. Show all calculations. 246 Young Brands caps: Jogging suits: baseball, football, and hockey shirts and various accesso-4 ries (such as tote bags, scarves, and towels) DE CHANGES IN YB'S GLOBAL MARKETING STRATEGY About a year ago, the senior managers concluded that YB products in global markets were "underappreciated and that "sales could-and should-be substantially higher." See Exhibit 06.1 for recent global sales results. They reasoned that trade shows in the major international markets are a relatively Inexpensive way to display the company's products and provide an opportunity to meet major corporate buyers face to face That is precisely what happened. The firm's exhibits were impressive, for- mer athletes were used as spokespersons, and the company made important contacts with Asian and European buyers. The long-term plan is to eliminate the use of MRs and to sell directly to major retail chains. This will improve market saturation in metropolitan areas and end the commissions paid to the MR network (currently about 6 percent of revenue on average). As a result of this, YB's sales growth is expected to increase sharply in the next three years, and revenues are estimated to more than double by the end of 2018. The marketing vice president forecasts worldwide sales of $160 million in 2016. $200 million in 2017 and $250 million in 2018. Management is pleased with the forecast because it is evidence of what they have long believed that the company manufactures quality products with global appeal at a reason- able price. The downside is that such growth will undoubtedly require external financing and could cause administrative and operational difficulties. Although YB will explore a number of financing alternatives, it is recog- nized that the first step is to estimate the external funds needed for the period ahead. After all, before a financing option is explored, a reasonable projection EXHIBIT C6.1 Recent Financial Results Sales Price-Earnings Smillions Ratio (times) 2015 $1232 11.4 2014 $111.3 13.5 2013 $1046 2012 $1010 142 2011 $ 96.4 14.0 91.2 EXHIBIT C6.2 Financial Statements ($ millions) Income Statement 2015 Other Financial Data 2015 Sales $123.2 Beta Cost of goods sold Risk-free return Gross margin Market return required Operating expenses Dividend yield Earnings before Growth in stock price over previous 3 years Taxes (40%) Earnings per share Net income $ 10.8 Dividends per share 180 taxes $10.80 Balance Sheet 2015 Liabilities $ 2.6 Accounts payable IN Assets Cash and short-term investments Accounts receivable Inventory Current assets Gross fixed assets Net fixed assets Total assets 13.0 13.0 $ 28.6 $ 55.0 39.8 $ 68.4 Notes payable Other current liabilities Current liabilities Bonds and bank debt Owners' equity Total liabilities and owners' equity DINO * After accumulated depreciation EXHIBIT C6.3 Selected Industry Ratios and Other Financial Data Current ratio 3.1 times Quick ratio 1.5 times Debt ratio 46.8% Times interest earned 10.6 times D 1. Using information from the case and also from Exhibits 6.1 and 6.2 develop a pro forma income statement for 2016. Assume that depreciation equals the 2015 amount plus one-sixth of 2016 capital spending. The relevant company tax rate is 40%. Enter answer... D 2. Using information from the pro forma income statement derived in #1, and also Exhibits C 6.2 and 6.3 and other case information, calculate the inventory for 2016. (Hint: First, calculate inventory turnover and then calculate inventory by dividing COGS by the inventory turnover number. Remember, you are calculating the 2016 inventory.). Show all calculations Enter answer... D 3. Using 2016 pro forma sales information, calculate and forecast the amount of payables for 2016. Show all calculations. 246 Young Brands caps: Jogging suits: baseball, football, and hockey shirts and various accesso-4 ries (such as tote bags, scarves, and towels) DE CHANGES IN YB'S GLOBAL MARKETING STRATEGY About a year ago, the senior managers concluded that YB products in global markets were "underappreciated and that "sales could-and should-be substantially higher." See Exhibit 06.1 for recent global sales results. They reasoned that trade shows in the major international markets are a relatively Inexpensive way to display the company's products and provide an opportunity to meet major corporate buyers face to face That is precisely what happened. The firm's exhibits were impressive, for- mer athletes were used as spokespersons, and the company made important contacts with Asian and European buyers. The long-term plan is to eliminate the use of MRs and to sell directly to major retail chains. This will improve market saturation in metropolitan areas and end the commissions paid to the MR network (currently about 6 percent of revenue on average). As a result of this, YB's sales growth is expected to increase sharply in the next three years, and revenues are estimated to more than double by the end of 2018. The marketing vice president forecasts worldwide sales of $160 million in 2016. $200 million in 2017 and $250 million in 2018. Management is pleased with the forecast because it is evidence of what they have long believed that the company manufactures quality products with global appeal at a reason- able price. The downside is that such growth will undoubtedly require external financing and could cause administrative and operational difficulties. Although YB will explore a number of financing alternatives, it is recog- nized that the first step is to estimate the external funds needed for the period ahead. After all, before a financing option is explored, a reasonable projection EXHIBIT C6.1 Recent Financial Results Sales Price-Earnings Smillions Ratio (times) 2015 $1232 11.4 2014 $111.3 13.5 2013 $1046 2012 $1010 142 2011 $ 96.4 14.0 91.2 EXHIBIT C6.2 Financial Statements ($ millions) Income Statement 2015 Other Financial Data 2015 Sales $123.2 Beta Cost of goods sold Risk-free return Gross margin Market return required Operating expenses Dividend yield Earnings before Growth in stock price over previous 3 years Taxes (40%) Earnings per share Net income $ 10.8 Dividends per share 180 taxes $10.80 Balance Sheet 2015 Liabilities $ 2.6 Accounts payable IN Assets Cash and short-term investments Accounts receivable Inventory Current assets Gross fixed assets Net fixed assets Total assets 13.0 13.0 $ 28.6 $ 55.0 39.8 $ 68.4 Notes payable Other current liabilities Current liabilities Bonds and bank debt Owners' equity Total liabilities and owners' equity DINO * After accumulated depreciation EXHIBIT C6.3 Selected Industry Ratios and Other Financial Data Current ratio 3.1 times Quick ratio 1.5 times Debt ratio 46.8% Times interest earned 10.6 times


