

Question
d) Estimate the value of a share of Intel common stock using the discounted cash flow (DCF) model as of December 29, 2012; assume a
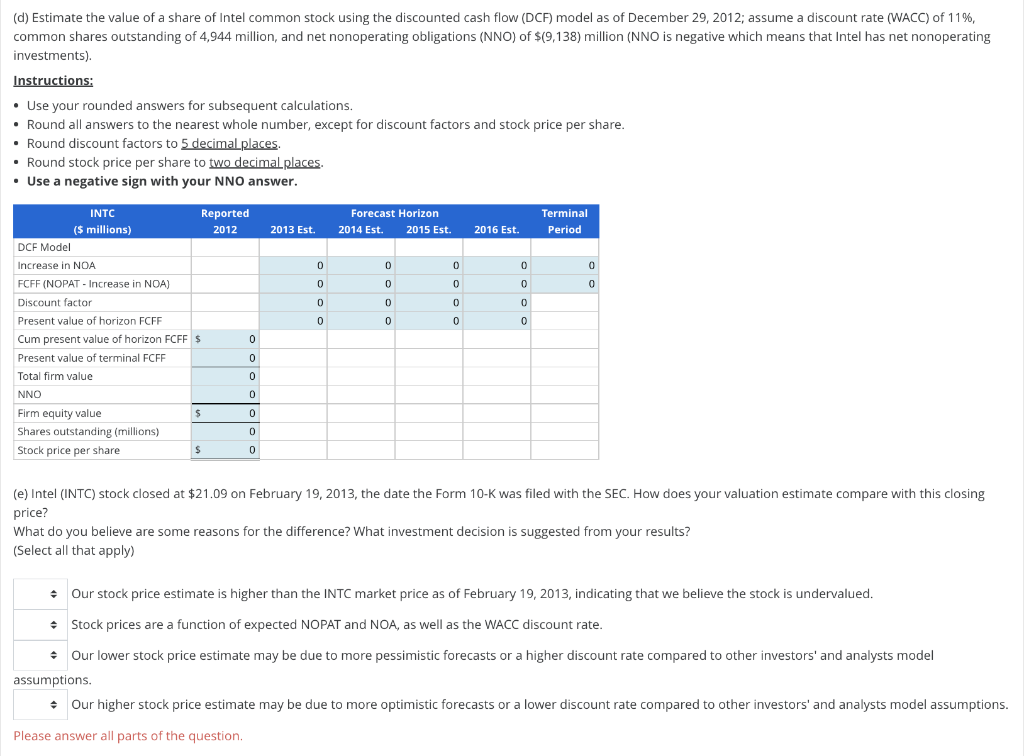
d) Estimate the value of a share of Intel common stock using the discounted cash flow (DCF) model as of December 29, 2012; assume a discount rate (WACC) of 11%, common shares outstanding of 4,944 million, and net nonoperating obligations (NNO) of $(9,138) million (NNO is negative which means that Intel has net nonoperating investments).
Instructions:
-
Use your rounded answers for subsequent calculations.
-
Round all answers to the nearest whole number, except for discount factors and stock price per share.
- Round discount factors to 5 decimal places.
- Round stock price per share to two decimal places.
- Use a negative sign with your NNO answer.
(e) Intel (INTC) stock closed at $21.09 on February 19, 2013, the date the Form 10-K was filed with the SEC. How does your valuation estimate compare with this closing price? What do you believe are some reasons for the difference? What investment decision is suggested from your results? (Select all that apply) Answeryesno Our stock price estimate is higher than the INTC market price as of February 19, 2013, indicating that we believe the stock is undervalued. Answeryesno Stock prices are a function of expected NOPAT and NOA, as well as the WACC discount rate. Answeryesno Our lower stock price estimate may be due to more pessimistic forecasts or a higher discount rate compared to other investors' and analysts model assumptions. Answeryesno Our higher stock price estimate may be due to more optimistic forecasts or a lower discount rate compared to other investors' and analysts model assumptions.
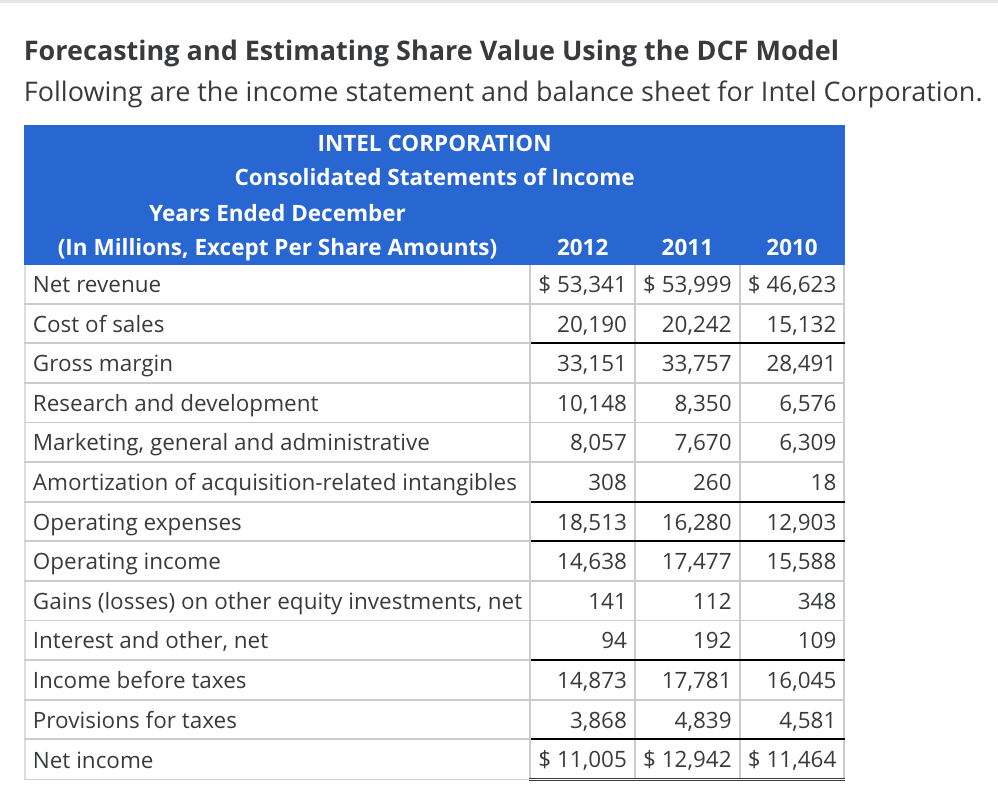
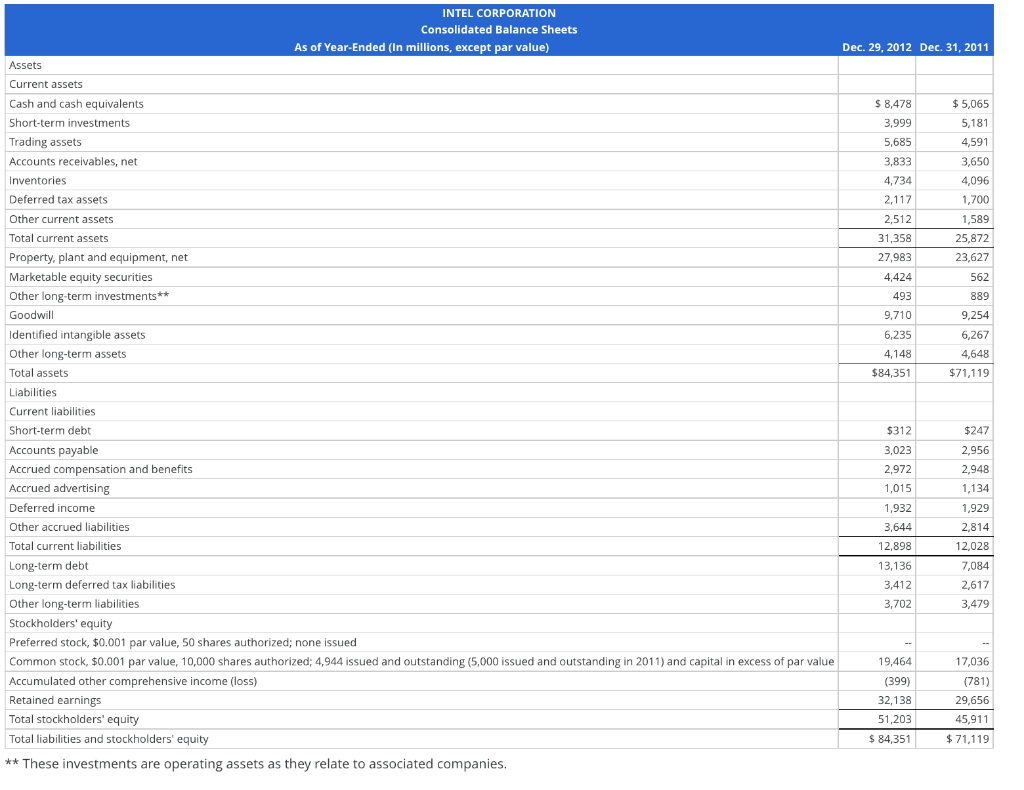
Forecasting and Estimating Share Value Using the DCF Model Following are the income statement and balance sheet for Intel Corporation. INTEL CORPORATION Consolidated Statements of Income Years Ended December (In Millions, Except Per Share Amounts) 2012 2011 2010 Net revenue $ 53,341 $ 53,999 $ 46,623 Cost of sales 20,190 20,242 15,132 Gross margin 33,151 33,757 28,491 Research and development 10,148 8,350 6,576 Marketing, general and administrative 8,057 7,670 6,309 Amortization of acquisition-related intangibles 308 260 18 Operating expenses 18,513 16,280 12,903 Operating income 14,638 17,477 15,588 Gains (losses) on other equity investments, net 141 112 348 Interest and other, net 94 192 109 Income before taxes 14,873 17,781 16,045 Provisions for taxes 3,868 4,839 4,581 Net income $ 11,005 $ 12,942 $ 11,464 Dec. 29, 2012 Dec. 31, 2011 , $ 8,478 3,999 5,685 $ 5,065 5,181 4,591 3,650 4,096 3,833 4,734 2,117 2,512 31,358 1,700 1,589 25,872 23,627 27,983 562 889 9,254 4,424 493 9,710 6,235 4,148 $84,351 6,267 4,648 $71,119 INTEL CORPORATION Consolidated Balance Sheets As of Year-Ended (in millions, except par value) Assets Current assets Cash and cash equivalents Short-term investments Trading assets Accounts receivables, net Inventories Deferred tax assets Other current assets Total current assets Property, plant and equipment, net Marketable equity securities Other long-term investments** Goodwill Identified intangible assets Other long-term assets Total assets Liabilities Current liabilities Short-term debt Accounts payable Accrued compensation and benefits Accrued advertising Deferred income Other accrued liabilities Total current liabilities Long-term debt Long-term deferred tax liabilities Other long-term liabilities Stockholders' equity Preferred stock, $0.001 par value, 50 shares authorized: none issued Common stock, $0.001 par value, 10,000 shares authorized; 4,944 issued and outstanding (5,000 issued and outstanding in 2011) and capital in excess of par value Accumulated other comprehensive income (loss) Retained earnings Total stockholders' equity Total liabilities and stockholders' equity ** These investments are operating assets as they relate to associated companies, $247 2,956 2,948 1,134 $312 3,023 2,972 1,015 1,932 3,644 12,898 13,136 3,412 3,702 1,929 2,814 12,028 7,084 2,617 3,479 19,464 (399) 32,138 51,203 $ 84,351 17,036 (781) 29,656 45,911 $ 71,119 (d) Estimate the value of a share of Intel common stock using the discounted cash flow (DCF) model as of December 29, 2012; assume a discount rate (WACC) of 11%, common shares outstanding of 4,944 million, and net nonoperating obligations (NNO) of $(9,138) million (NNO is negative which means that Intel has net nonoperating investments) Instructions: Use your rounded answers for subsequent calculations. Round all answers to the nearest whole number, except for discount factors and stock price per share. Round discount factors to 5 decimal places . Round stock price per share to two decimal places. Use a negative sign with your NNO answer. Forecast Horizon 2013 Est. 2014 Est. 2015 Est. Terminal Period 2016 Est. 0 0 0 0 0 0 0 0 0 0 0 0 0 0 0 0 0 0 0 0 0 INTC Reported ($ millions) () 2012 DCF Model Increase in NOA FCFF (NOPAT - Increase in NOA) Discount factor Present value of horizon FCFF Cum present value of horizon FCFF $ 0 Present value of terminal FCFF 0 Total firm value 0 0 NNO 0 0 Firm equity value $ 0 Shares outstanding (millions) 0 0 Stock price per share $ 0 (e) Intel (INTC) stock closed at $21.09 on February 19, 2013, the date the Form 10-K was filed with the SEC. How does your valuation estimate compare with this closing price? What do you believe are some reasons for the difference? What investment decision is suggested from your results? (Select all that apply) Our stock price estimate is higher than the INTC market price as of February 19, 2013, indicating that we believe the stock is undervalued. Stock prices are a function of expected NOPAT and NOA, as well as the WACC discount rate. Our lower stock price estimate may be due to more pessimistic forecasts or a higher discount rate compared to other investors' and analysts model assumptions. Our higher stock price estimate may be due to more optimistic forecasts or a lower discount rate compared to other investors' and analysts model assumptions. Please answer all parts of the question, Forecasting and Estimating Share Value Using the DCF Model Following are the income statement and balance sheet for Intel Corporation. INTEL CORPORATION Consolidated Statements of Income Years Ended December (In Millions, Except Per Share Amounts) 2012 2011 2010 Net revenue $ 53,341 $ 53,999 $ 46,623 Cost of sales 20,190 20,242 15,132 Gross margin 33,151 33,757 28,491 Research and development 10,148 8,350 6,576 Marketing, general and administrative 8,057 7,670 6,309 Amortization of acquisition-related intangibles 308 260 18 Operating expenses 18,513 16,280 12,903 Operating income 14,638 17,477 15,588 Gains (losses) on other equity investments, net 141 112 348 Interest and other, net 94 192 109 Income before taxes 14,873 17,781 16,045 Provisions for taxes 3,868 4,839 4,581 Net income $ 11,005 $ 12,942 $ 11,464 Dec. 29, 2012 Dec. 31, 2011 , $ 8,478 3,999 5,685 $ 5,065 5,181 4,591 3,650 4,096 3,833 4,734 2,117 2,512 31,358 1,700 1,589 25,872 23,627 27,983 562 889 9,254 4,424 493 9,710 6,235 4,148 $84,351 6,267 4,648 $71,119 INTEL CORPORATION Consolidated Balance Sheets As of Year-Ended (in millions, except par value) Assets Current assets Cash and cash equivalents Short-term investments Trading assets Accounts receivables, net Inventories Deferred tax assets Other current assets Total current assets Property, plant and equipment, net Marketable equity securities Other long-term investments** Goodwill Identified intangible assets Other long-term assets Total assets Liabilities Current liabilities Short-term debt Accounts payable Accrued compensation and benefits Accrued advertising Deferred income Other accrued liabilities Total current liabilities Long-term debt Long-term deferred tax liabilities Other long-term liabilities Stockholders' equity Preferred stock, $0.001 par value, 50 shares authorized: none issued Common stock, $0.001 par value, 10,000 shares authorized; 4,944 issued and outstanding (5,000 issued and outstanding in 2011) and capital in excess of par value Accumulated other comprehensive income (loss) Retained earnings Total stockholders' equity Total liabilities and stockholders' equity ** These investments are operating assets as they relate to associated companies, $247 2,956 2,948 1,134 $312 3,023 2,972 1,015 1,932 3,644 12,898 13,136 3,412 3,702 1,929 2,814 12,028 7,084 2,617 3,479 19,464 (399) 32,138 51,203 $ 84,351 17,036 (781) 29,656 45,911 $ 71,119 (d) Estimate the value of a share of Intel common stock using the discounted cash flow (DCF) model as of December 29, 2012; assume a discount rate (WACC) of 11%, common shares outstanding of 4,944 million, and net nonoperating obligations (NNO) of $(9,138) million (NNO is negative which means that Intel has net nonoperating investments) Instructions: Use your rounded answers for subsequent calculations. Round all answers to the nearest whole number, except for discount factors and stock price per share. Round discount factors to 5 decimal places . Round stock price per share to two decimal places. Use a negative sign with your NNO answer. Forecast Horizon 2013 Est. 2014 Est. 2015 Est. Terminal Period 2016 Est. 0 0 0 0 0 0 0 0 0 0 0 0 0 0 0 0 0 0 0 0 0 INTC Reported ($ millions) () 2012 DCF Model Increase in NOA FCFF (NOPAT - Increase in NOA) Discount factor Present value of horizon FCFF Cum present value of horizon FCFF $ 0 Present value of terminal FCFF 0 Total firm value 0 0 NNO 0 0 Firm equity value $ 0 Shares outstanding (millions) 0 0 Stock price per share $ 0 (e) Intel (INTC) stock closed at $21.09 on February 19, 2013, the date the Form 10-K was filed with the SEC. How does your valuation estimate compare with this closing price? What do you believe are some reasons for the difference? What investment decision is suggested from your results? (Select all that apply) Our stock price estimate is higher than the INTC market price as of February 19, 2013, indicating that we believe the stock is undervalued. Stock prices are a function of expected NOPAT and NOA, as well as the WACC discount rate. Our lower stock price estimate may be due to more pessimistic forecasts or a higher discount rate compared to other investors' and analysts model assumptions. Our higher stock price estimate may be due to more optimistic forecasts or a lower discount rate compared to other investors' and analysts model assumptions. Please answer all parts of the
Step by Step Solution
There are 3 Steps involved in it
Step: 1

Get Instant Access to Expert-Tailored Solutions
See step-by-step solutions with expert insights and AI powered tools for academic success
Step: 2

Step: 3
Ace Your Homework with AI
Get the answers you need in no time with our AI-driven, step-by-step assistance
Get Started
Personal Financial Literacy
Authors: Joan S. Ryan , Christie Ryan
3rd Edition
1337412686,1305980697