

Answered step by step
Verified Expert Solution
Question
1 Approved Answer
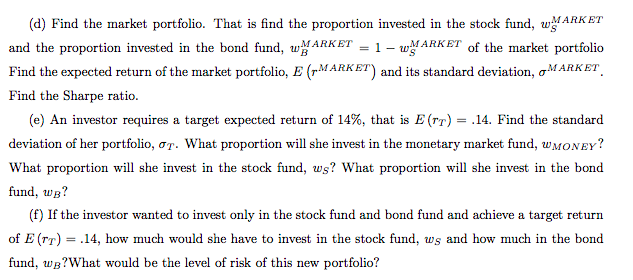
[d] Find the market portfolio. That is nd the proportion invested in the stool: fund, wngRKET and the proportion invested in the bond fund, WELFARE
Step by Step Solution
There are 3 Steps involved in it
Step: 1

Get Instant Access to Expert-Tailored Solutions
See step-by-step solutions with expert insights and AI powered tools for academic success
Step: 2

Step: 3
Ace Your Homework with AI
Get the answers you need in no time with our AI-driven, step-by-step assistance
Get Started
Exploring Economics
Authors: Robert L Sexton
5th Edition
978-1439040249, 1439040249