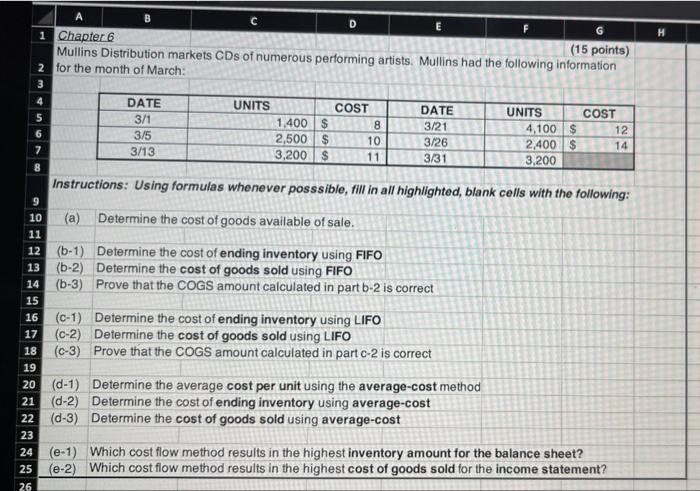
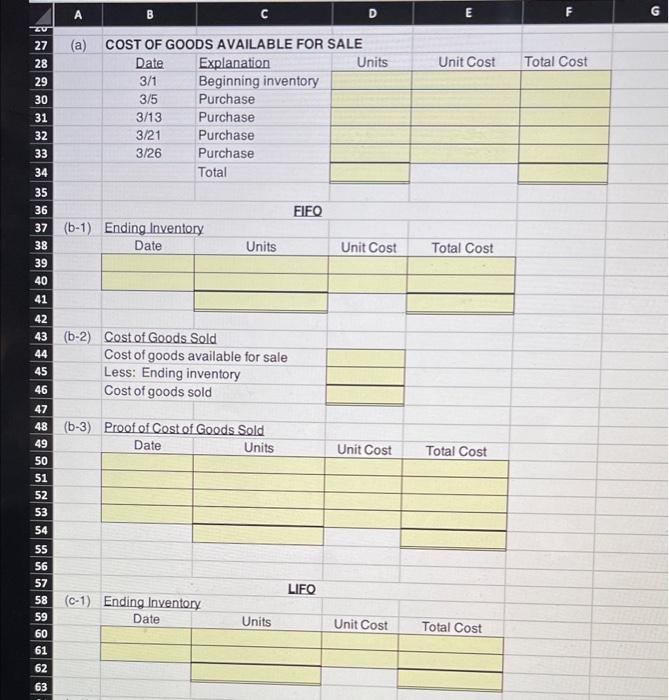
D G H i Chapter 6 (15 points) Mullins Distribution markets CDs of numerous performing artists. Mullins had the following information 2 for the month of March: 3 4 5 DATE 3/1 3/5 3/13 6 UNITS COST 1,400 $ 8 2,500 $ 10 3,200 $ 11 DATE 3/21 3/26 3/31 UNITS 4,100 $ 2,400 $ 3,200 COST 12 14 7 8 Instructions: Using formulas whenever posssible, fill in all highlighted, blank cells with the following: 9 10 (a) Determine the cost of goods available of sale. 11 12 (b-1) Determine the cost of ending inventory using FIFO 13 (6-2) Determine the cost of goods sold using FIFO 14 (6-3) Prove that the COGS amount calculated in part 6-2 is correct (C-1) Determine the cost of ending inventory using LIFO 17 (c-2) Determine the cost of goods sold using LIFO (C-3) Prove that the COGS amount calculated in part c-2 is correct (d-1) Determine the average cost per unit using the average-cost method (d-2) Determine the cost of ending inventory using average-cost (d-3) Determine the cost of goods sold using average-cost 15 16 18 19 20 21 22 23 24 (e-1) Which cost flow method results in the highest inventory amount for the balance sheet? 25 (e-2) Which cost flow method results in the highest cost of goods sold for the income statement? 26 A B C D E F G Unit Cost Total Cost 27 (a) COST OF GOODS AVAILABLE FOR SALE 28 Date Explanation Units 29 3/1 Beginning inventory 30 3/5 Purchase 31 3/13 Purchase 32 3/21 Purchase 33 3/26 Purchase Total 35 36 FIFO 37 (6-1) Ending Inventory 38 Date Units Unit Cost 39 40 34 Total Cost 41 Unit Cost Total Cost 42 43 (0-2) Cost of Goods Sold 44 Cost of goods available for sale 45 Less: Ending inventory 46 Cost of goods sold 47 48 (6-3) Proof of Cost of Goods Sold 49 Date Units 50 51 52 53 54 55 56 57 LIFO 58 (c-1) Ending Inventory 59 Date Units 60 61 Unit Cost Total Cost 62 63 D E F G H JU 59 Unit Cost Total Cost 57 LIFO 58 (c-1) Ending Inventory Date Units 60 61 62 63 64 (c-2) Cost of Goods Sold 65 Cost of goods available for sale 66 Less: Ending inventory 67 Cost of goods sold 68 (c-) Proof of Cost of Goods Sold Date Units Unit Cost Total Cost 69 70 71 72 73 74 75 76 77 78 (d-1) 79 80 81 AVERAGE COST Cost of goods available for sale Units available for sale Average cost per unit 82 83 (d-2) Ending Inventory 84 Units Unit Cost Total Cost 85 86 87 (d-3) Cost of Goods Sold 88 Cost of goods available for sale 89 Less: Ending inventory 90 Cost of goods sold 91 92 (e-1) The method which results in the highest ending inventory is: 93 e-2) The method which results in the highest COGS is: 94 95


