

Answered step by step
Verified Expert Solution
Question
1 Approved Answer
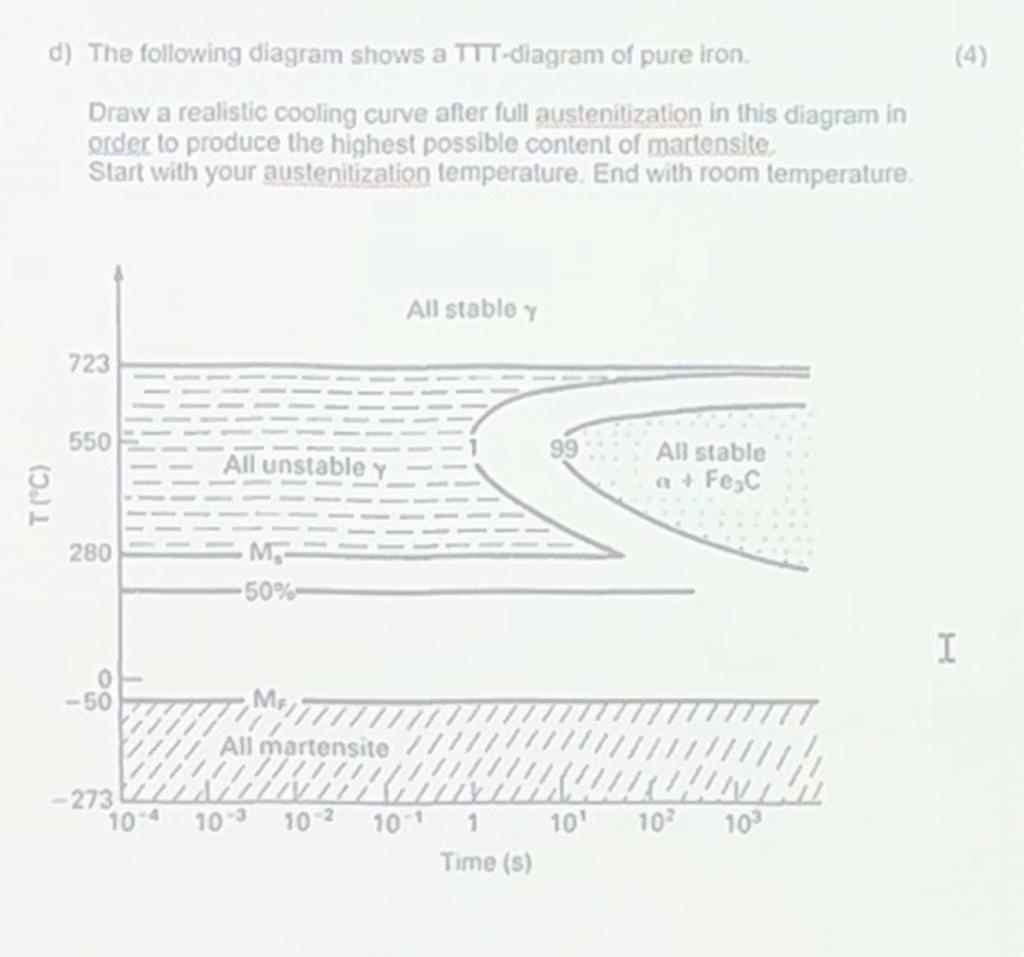
d ) The following diagram shows a TTT - diagram of pure iron. Draw a realistic cooling curve after full austenitization in this diagram in
d The following diagram shows a TTTdiagram of pure iron.
Draw a realistic cooling curve after full austenitization in this diagram in
order to produce the highest possible content of martensite.
Start with your austenitization temperature. End with room temperature. Draw the diagram by hand instead explaining how to plot
Step by Step Solution
There are 3 Steps involved in it
Step: 1

Get Instant Access to Expert-Tailored Solutions
See step-by-step solutions with expert insights and AI powered tools for academic success
Step: 2

Step: 3
Ace Your Homework with AI
Get the answers you need in no time with our AI-driven, step-by-step assistance
Get Started
Fundamentals of Ethics for Scientists and Engineers
Authors: Edmund G. Seebauer, Robert L. Barry
1st Edition
9780195698480, 195134885, 195698487, 978-0195134889