

Question: (d) Using the result of the previous question, fill in the value of 7 obtained from each fit in Data Table 1 and use the
![and show your percent difference calculation below. [5 pts] Data Table 1:](https://s3.amazonaws.com/si.experts.images/answers/2024/06/66794743bb79b_1316679474357f62.jpg)
![Experimental determination of L [5 pts] Rmeas = Component T Lexpt Inductor](https://s3.amazonaws.com/si.experts.images/answers/2024/06/6679474474d7a_132667947441891d.jpg)


![occur across the inductor? [5 pts] (f) Based on the experimental value](https://s3.amazonaws.com/si.experts.images/answers/2024/06/667947471422f_13466794746a77fd.jpg)
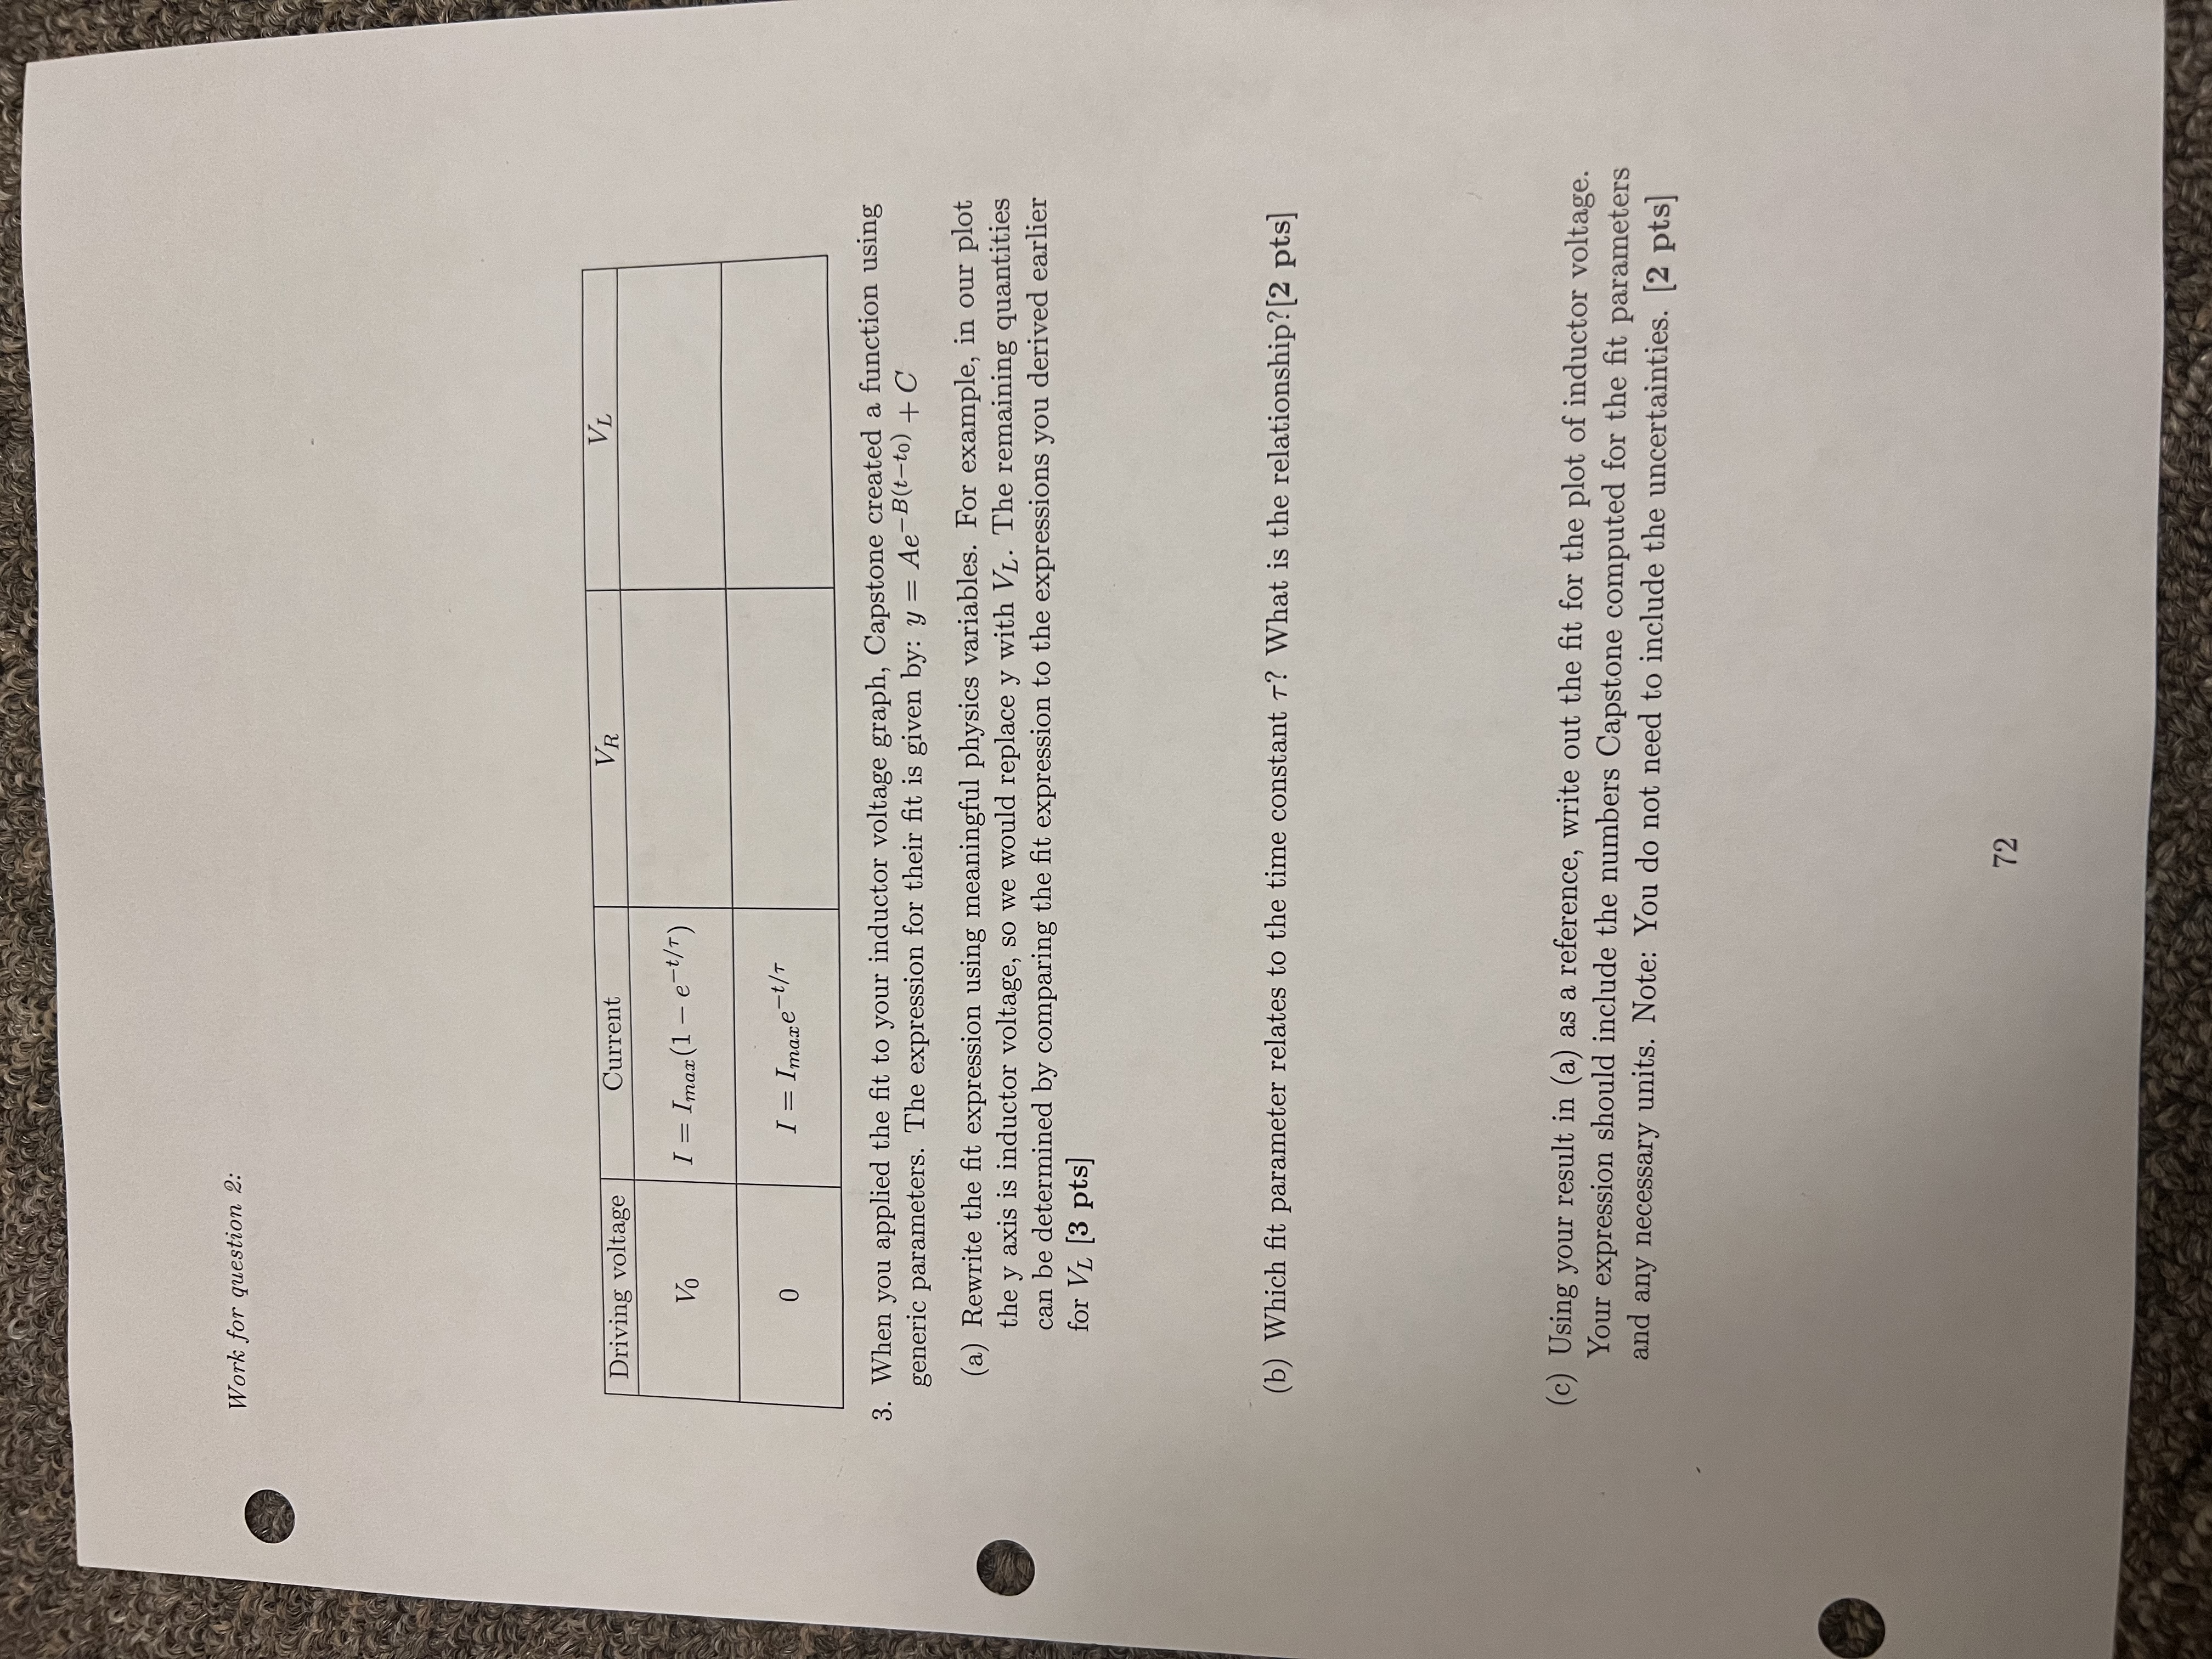
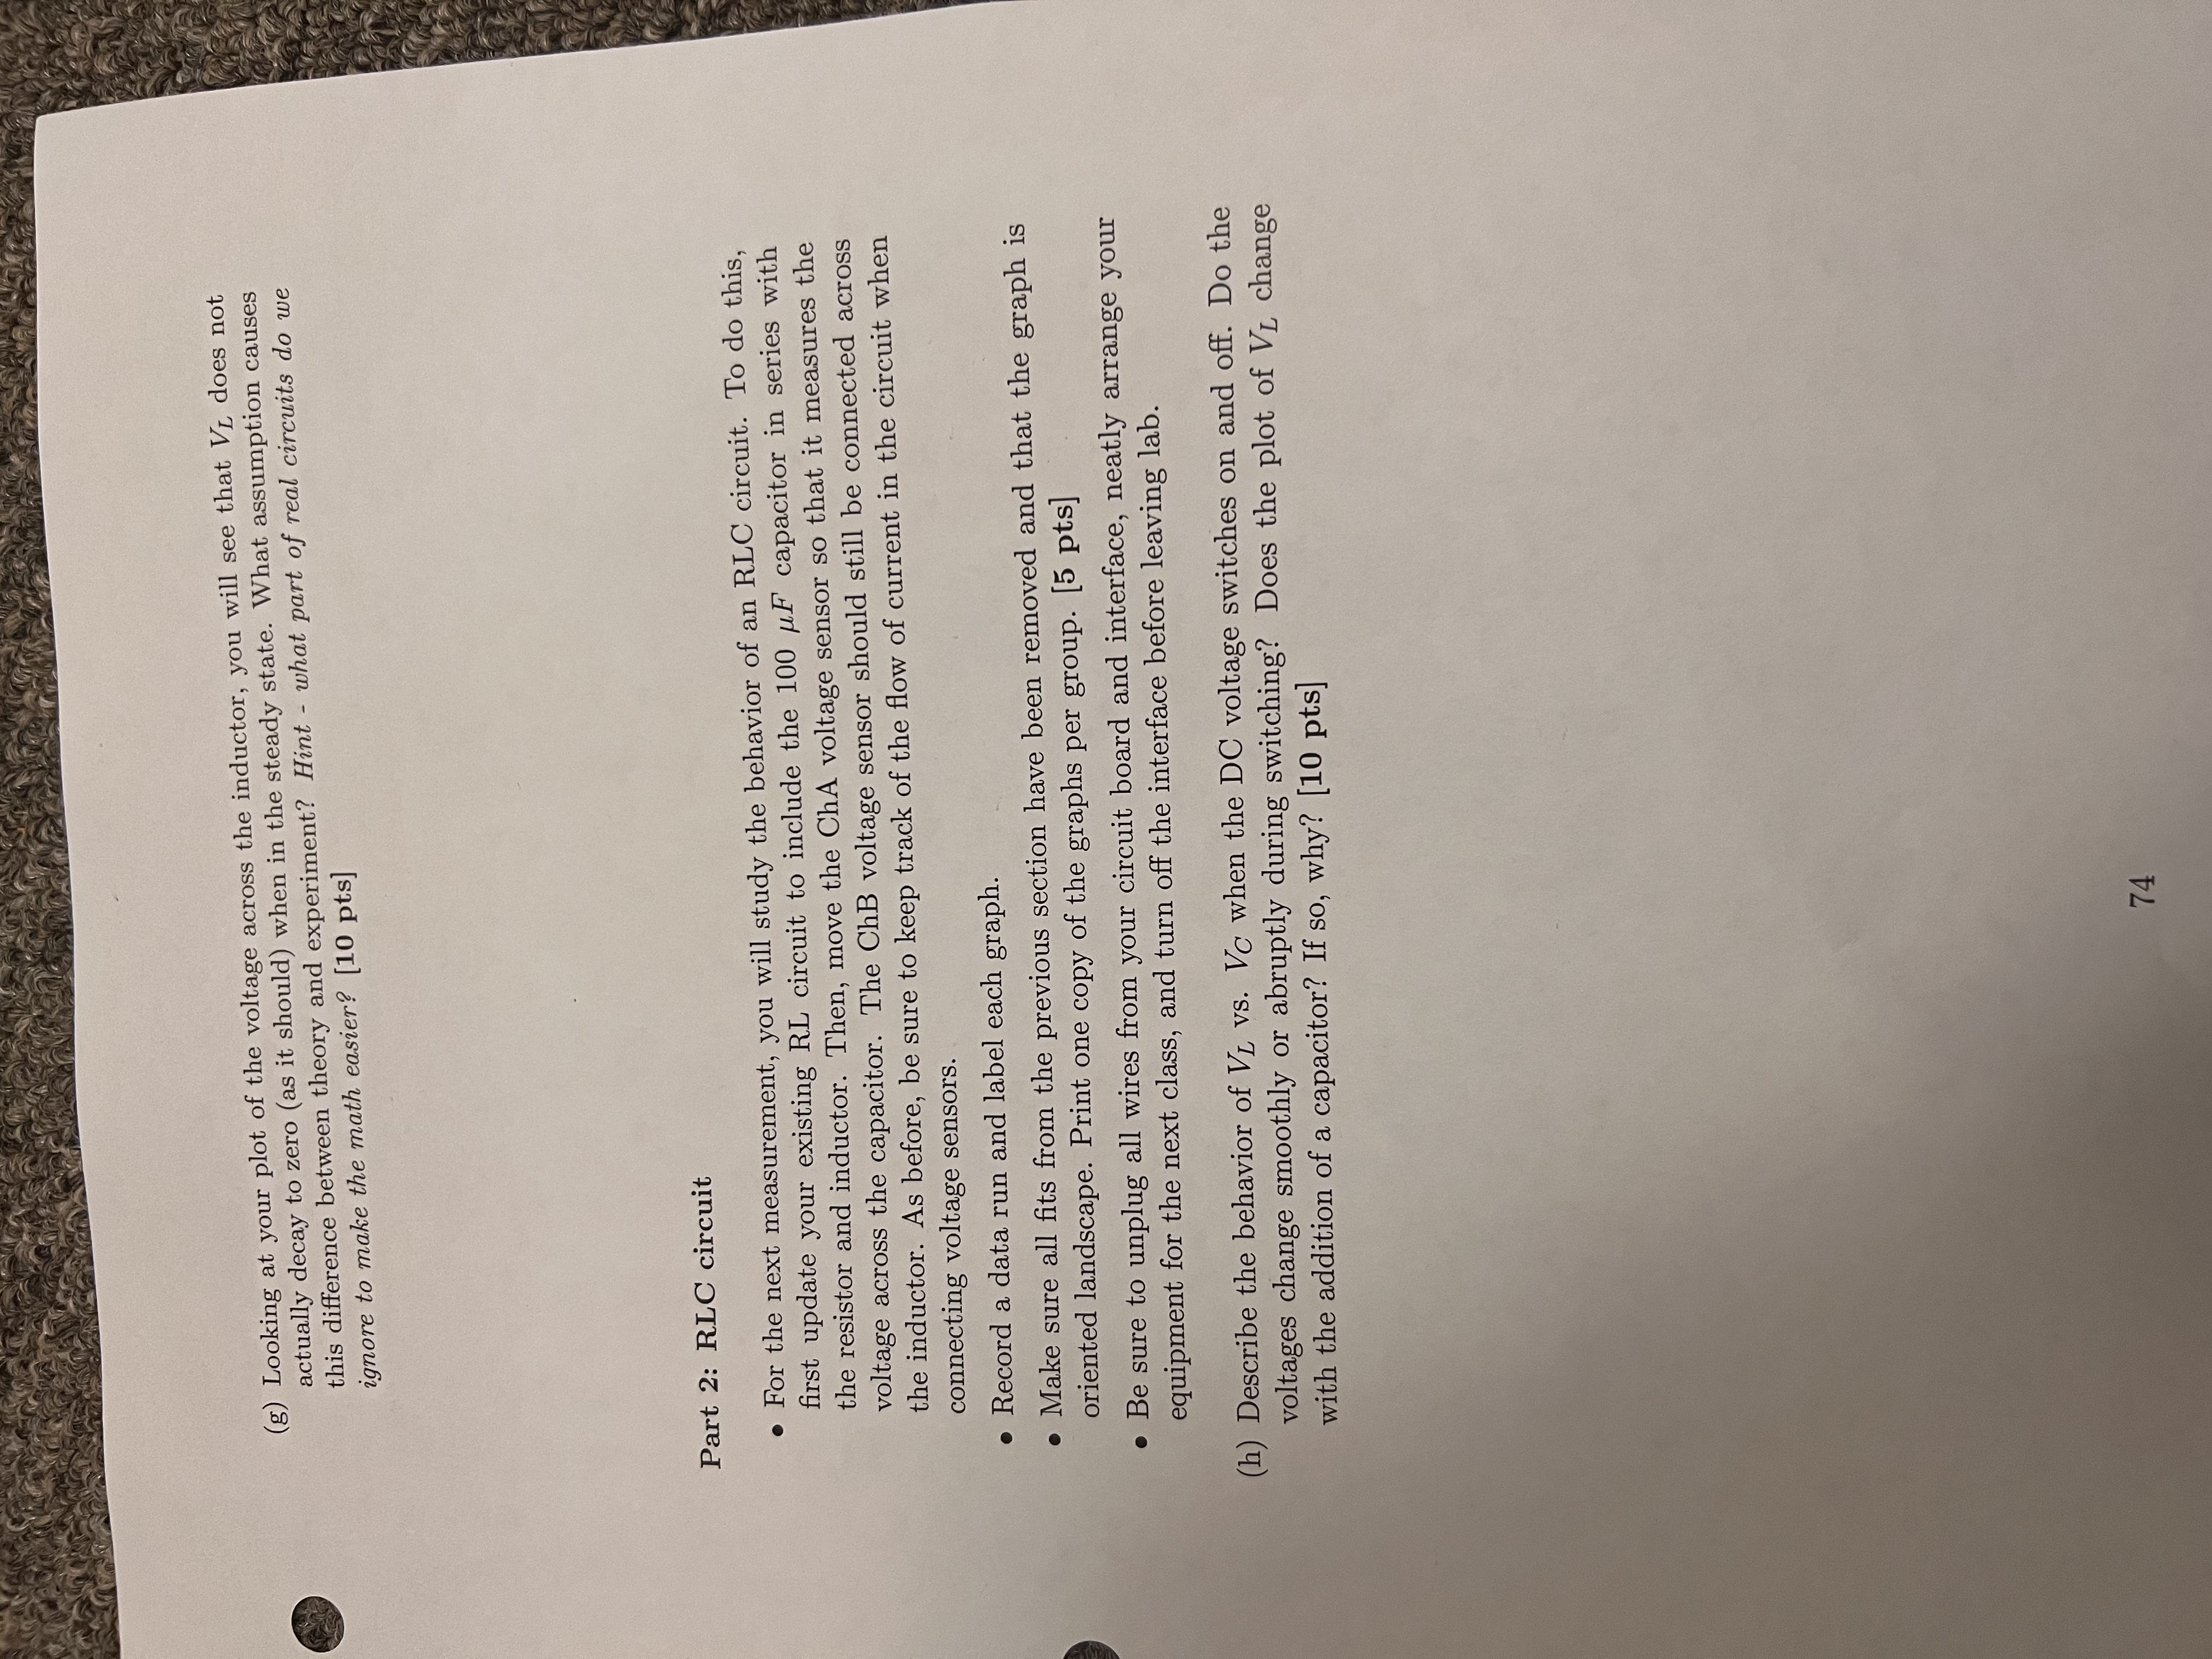
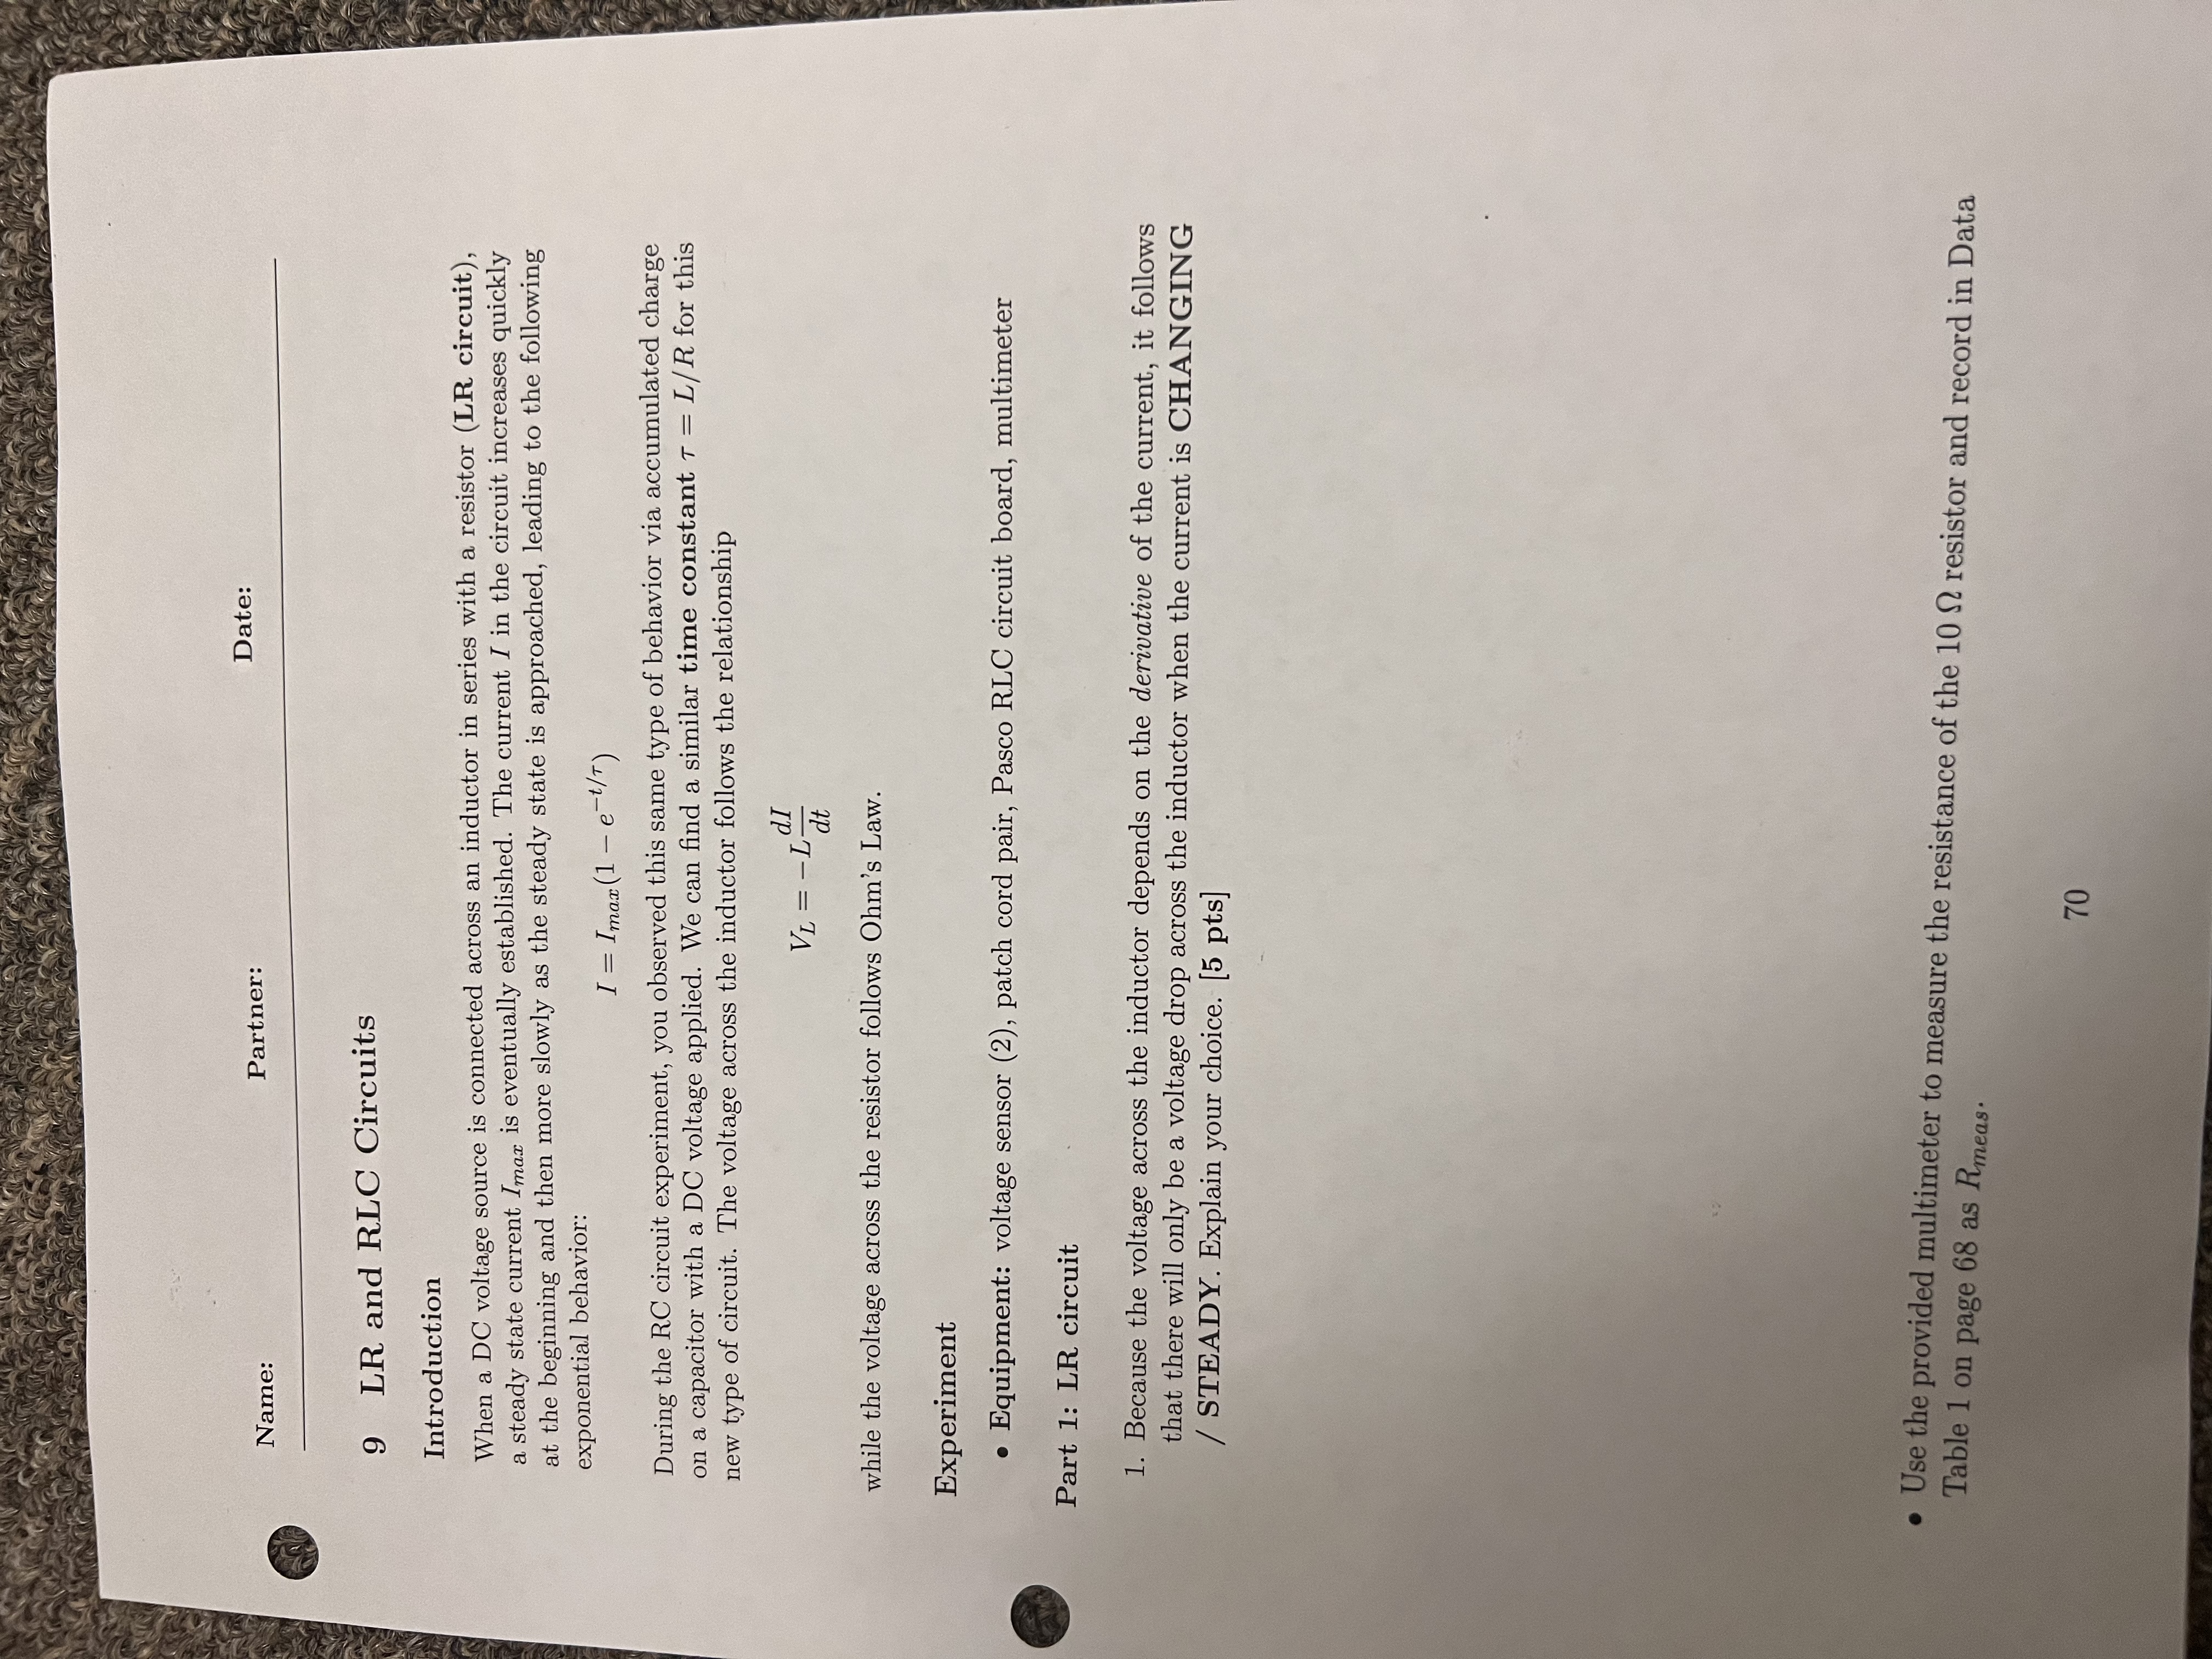
(d) Using the result of the previous question, fill in the value of 7 obtained from each fit in Data Table 1 and use the value of Rmeas to calculate Lexpt. Determine the percent difference between the average experimental L and the labeled value of 8.2 mH and show your percent difference calculation below. [5 pts] Data Table 1: Experimental determination of L [5 pts] Rmeas = Component T Lexpt Inductor Resistor Lavg = % difference : (e) Describe the behavior of VL vs. VR when the DC voltage switches on and off. Do the voltages change smoothly or abruptly during switching? When does the largest voltage occur across the inductor? [5 pts] (f) Based on the experimental value of 7 you obtained from the fit of the INDUCTOR voltage, how long does it take the current in the LR circuit to reach 90% of its maximum value when the voltage is switched on? Hint - start with the equation given in the Introduction and use I = 0.9 Imar. [10 pts] 73Work for question 2: Driving voltage Current VR VL Vo I = Imax(1 - e-t/T) I = Imaze-t/T 3. When you applied the fit to your inductor voltage graph, Capstone created a function using generic parameters. The expression for their fit is given by: y = Ae-B(t-to) + C (a) Rewrite the fit expression using meaningful physics variables. For example, in our plot the y axis is inductor voltage, so we would replace y with VL. The remaining quantities can be determined by comparing the fit expression to the expressions you derived earlier for VL [3 pts] (b) Which fit parameter relates to the time constant ? What is the relationship? [2 pts] (c) Using your result in (a) as a reference, write out the fit for the plot of inductor voltage. Your expression should include the numbers Capstone computed for the fit parameters and any necessary units. Note: You do not need to include the uncertainties. [2 pts] 72(g) Looking at your plot of the voltage across the inductor, you will see that VL does not actually decay to zero (as it should) when in the steady state. What assumption causes this difference between theory and experiment? Hint - what part of real circuits do we ignore to make the math easier? [10 pts] Part 2: RLC circuit . For the next measurement, you will study the behavior of an RLC circuit. To do this, first update your existing RL circuit to include the 100 uF capacitor in series with the resistor and inductor. Then, move the ChA voltage sensor so that it measures the voltage across the capacitor. The ChB voltage sensor should still be connected across the inductor. As before, be sure to keep track of the flow of current in the circuit when connecting voltage sensors. . Record a data run and label each graph. . Make sure all fits from the previous section have been removed and that the graph is oriented landscape. Print one copy of the graphs per group. [5 pts] . Be sure to unplug all wires from your circuit board and interface, neatly arrange your equipment for the next class, and turn off the interface before leaving lab. (h) Describe the behavior of VL vs. Vc when the DC voltage switches on and off. Do the voltages change smoothly or abruptly during switching? Does the plot of VL change with the addition of a capacitor? If so, why? [10 pts] 74Name: Partner: Date: 9 LR and RLC Circuits Introduction When a DC voltage source is connected across an inductor in series with a resistor (LR circuit), a steady state current Imar is eventually established. The current I in the circuit increases quickly at the beginning and then more slowly as the steady state is approached, leading to the following exponential behavior: I = Imax(1 -e-t/T) During the RC circuit experiment, you observed this same type of behavior via accumulated charge on a capacitor with a DC voltage applied. We can find a similar time constant 7 = L/R for this new type of circuit. The voltage across the inductor follows the relationship VL = -Ldt while the voltage across the resistor follows Ohm's Law. Experiment . Equipment: voltage sensor (2), patch cord pair, Pasco RLC circuit board, multimeter Part 1: LR circuit 1. Because the voltage across the inductor depends on the derivative of the current, it follows that there will only be a voltage drop across the inductor when the current is CHANGING / STEADY. Explain your choice. [5 pts] . Use the provided multimeter to measure the resistance of the 10 0 resistor and record in Data Table 1 on page 68 as Rmeas. 70. Check that the interface is ON. Open the Lab 9 Capstone file from the PHYS 208 Lab canvas course. The graphs are set up to display ChA voltage, ChB voltage, and output voltage vs. time. 8.2 mH inductor 109 3352 1 10082 100 UF 330 UF . First set up an LR circuit to measure the voltage across the 8.2 mH inductor and the 10 2 resistor. Connect the source voltage from the interface output across the series combination of the resistor and inductor. Then connect the ChA voltage sensor across the resistor and the ChB voltage sensor across the inductor. Note: Be sure to keep track of the flow of current while you set up your circuit. The red connector should always be connected to the upstream and Record a data run (recording should stop automatically after 0.02 seconds). Your graphs should display exponentially decaying behavior. . Autoscale all three plots, add a title to the plot and text boxes to each graph to indicate which voltage is being displayed. . On the inductor voltage plot, select the first data range that shows exponential behavior and apply a "Natural Exponential" fit to this data. Next, select the same time range on the resistor voltage plot and apply an "Inverse Exponent" fit. Note: You may see a non-zero voltage at t = 0, this should be ignored. All voltages should be zero initially. . Print one graph per group with a Landscape orientation. [5 pts] 2. Complete the table below using the provided voltage and current equations as well as infor- mation provided in the Introduction. Show the calculations for VR and VL in the given space [10 pts] 71
Step by Step Solution
There are 3 Steps involved in it

Get step-by-step solutions from verified subject matter experts