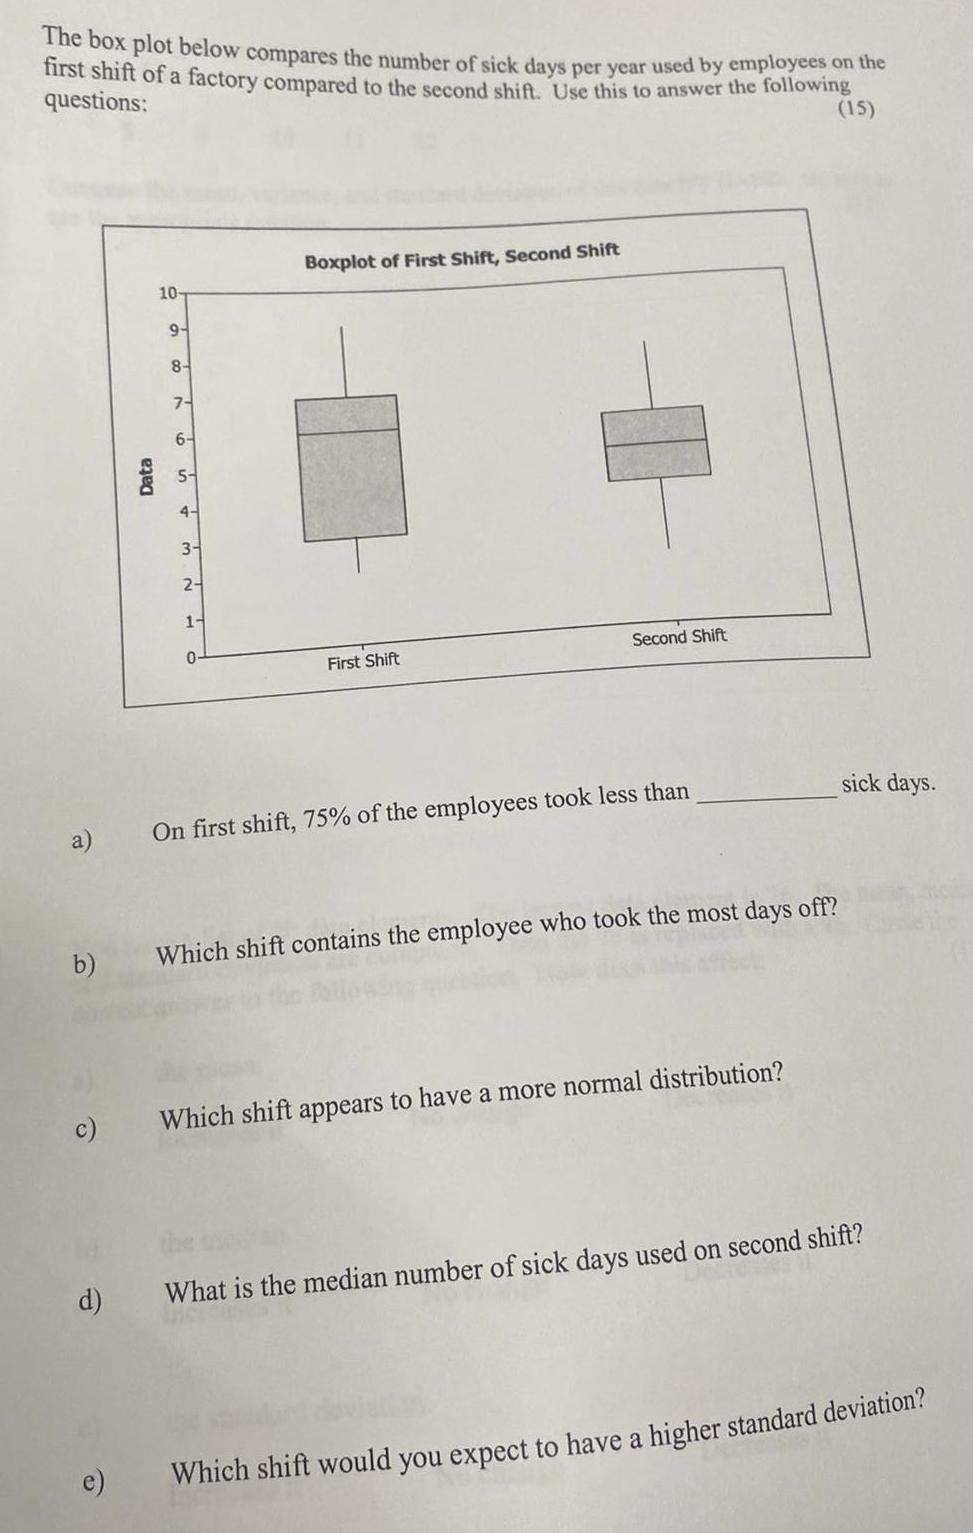
The box plot below compares the number of sick days per year used by employees on the ist smift of a factory compared to

The box plot below compares the number of sick days per year used by employees on the ist smift of a factory compared to the second shift. Use this to answer the following questions: (15) Boxplot of First Shift, Second Shift 10- 9- 8- 7- 6- 4- 3- 2- 1- 0- Second Shift First Shift sick days. a) On first shift, 75% of the employees took less than b) Which shift contains the employee who took the most days off? c) Which shift appears to have a more normal distribution? d) What is the median number of sick days used on second shift? Which shift would you expect to have a higher standard deviation? Data
Step by Step Solution
3.48 Rating (158 Votes )
There are 3 Steps involved in it
Step: 1
a On first shift 75 of the employees took less than ...
See step-by-step solutions with expert insights and AI powered tools for academic success
Step: 2

Step: 3

Ace Your Homework with AI
Get the answers you need in no time with our AI-driven, step-by-step assistance
Get Started


