Question: DATA ANALYTICS AT DBS GROUP AUDIT: THE FUTURE OF AUDITING IS AUDITING THE FUTURE Numbers have a convincing story to tell, when you know how
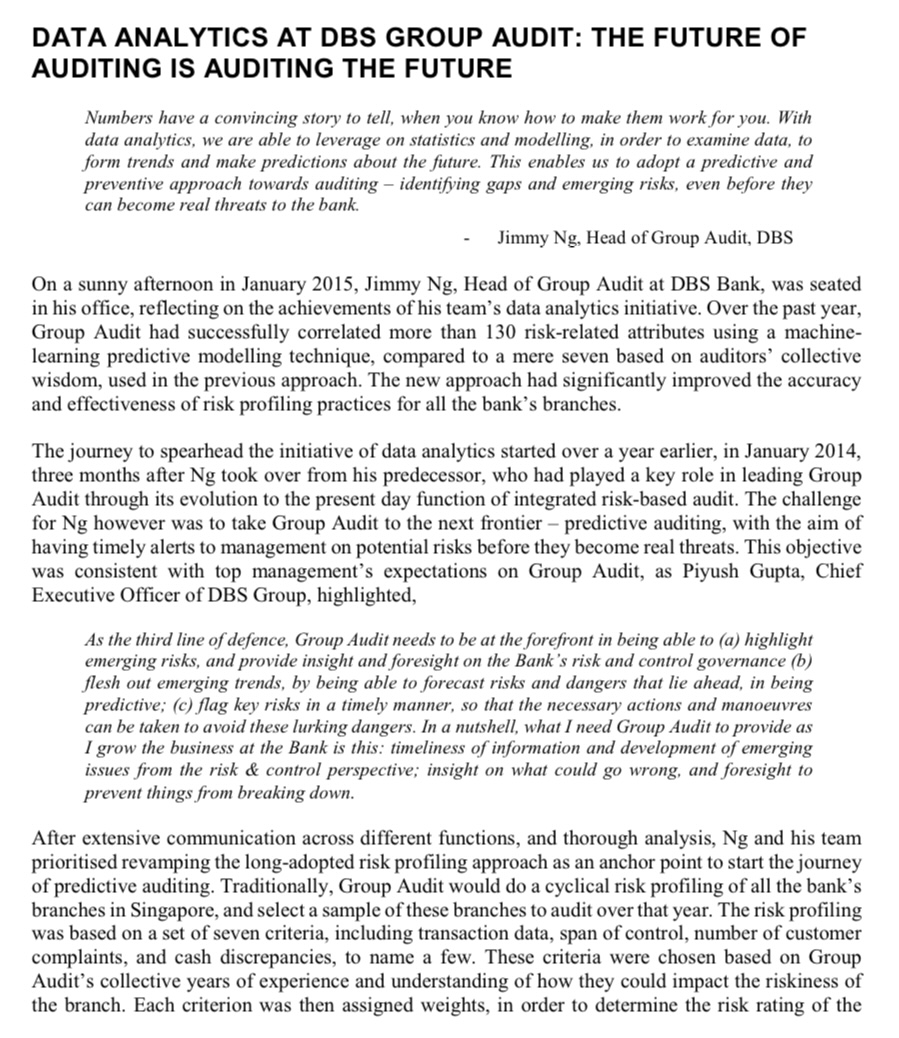
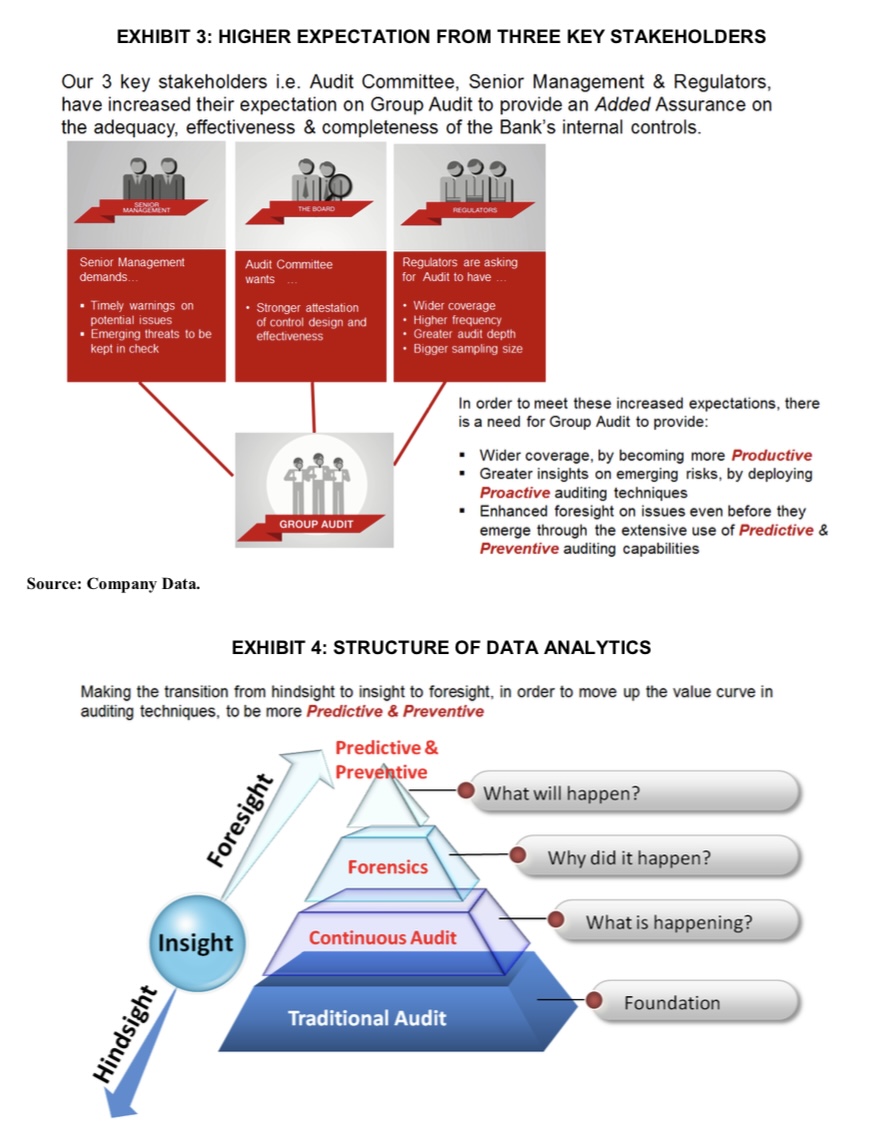
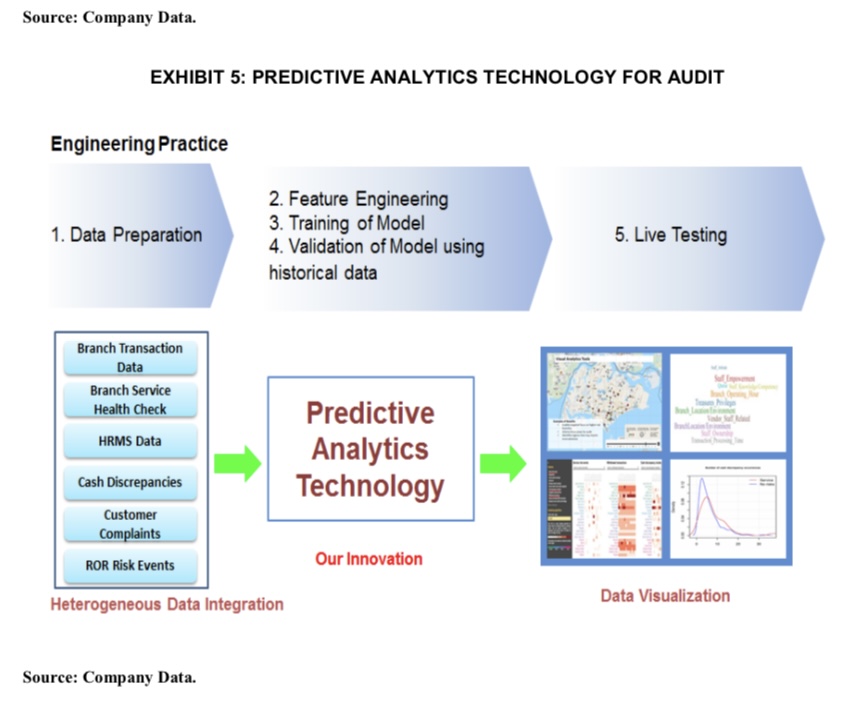
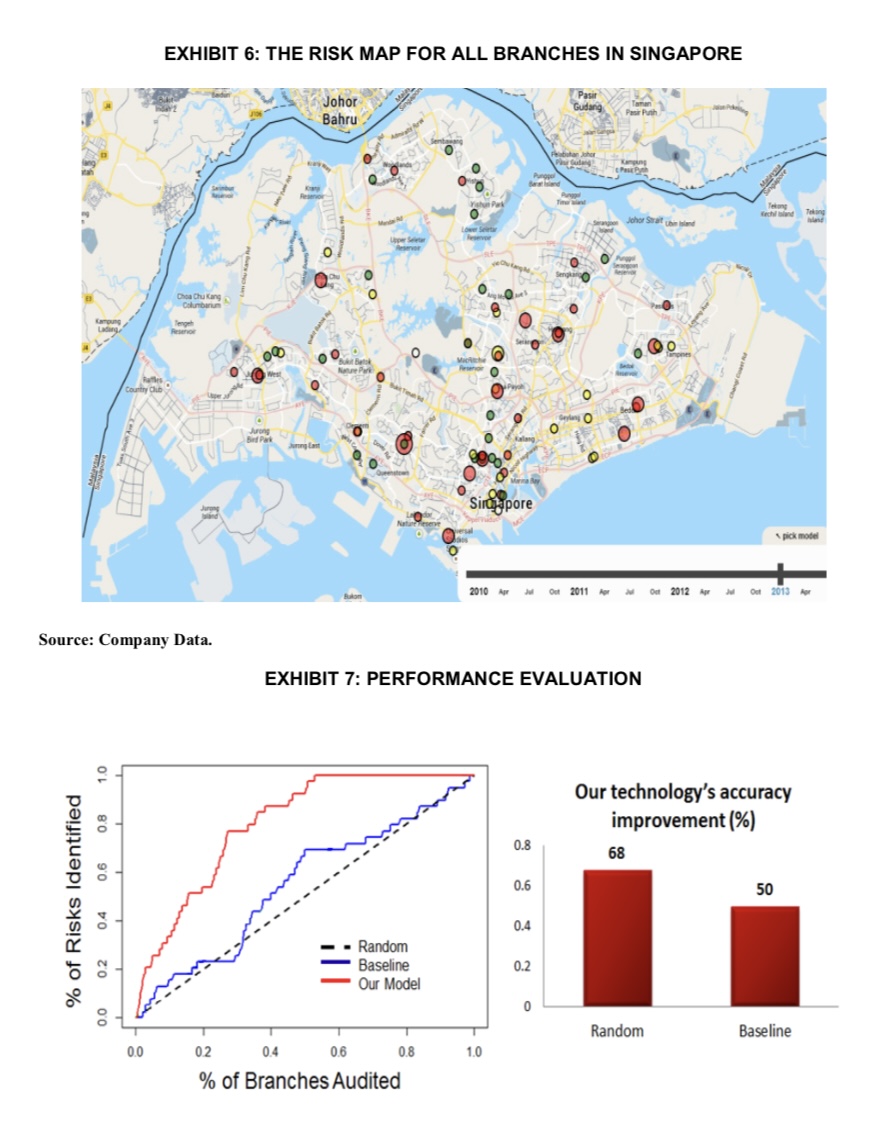
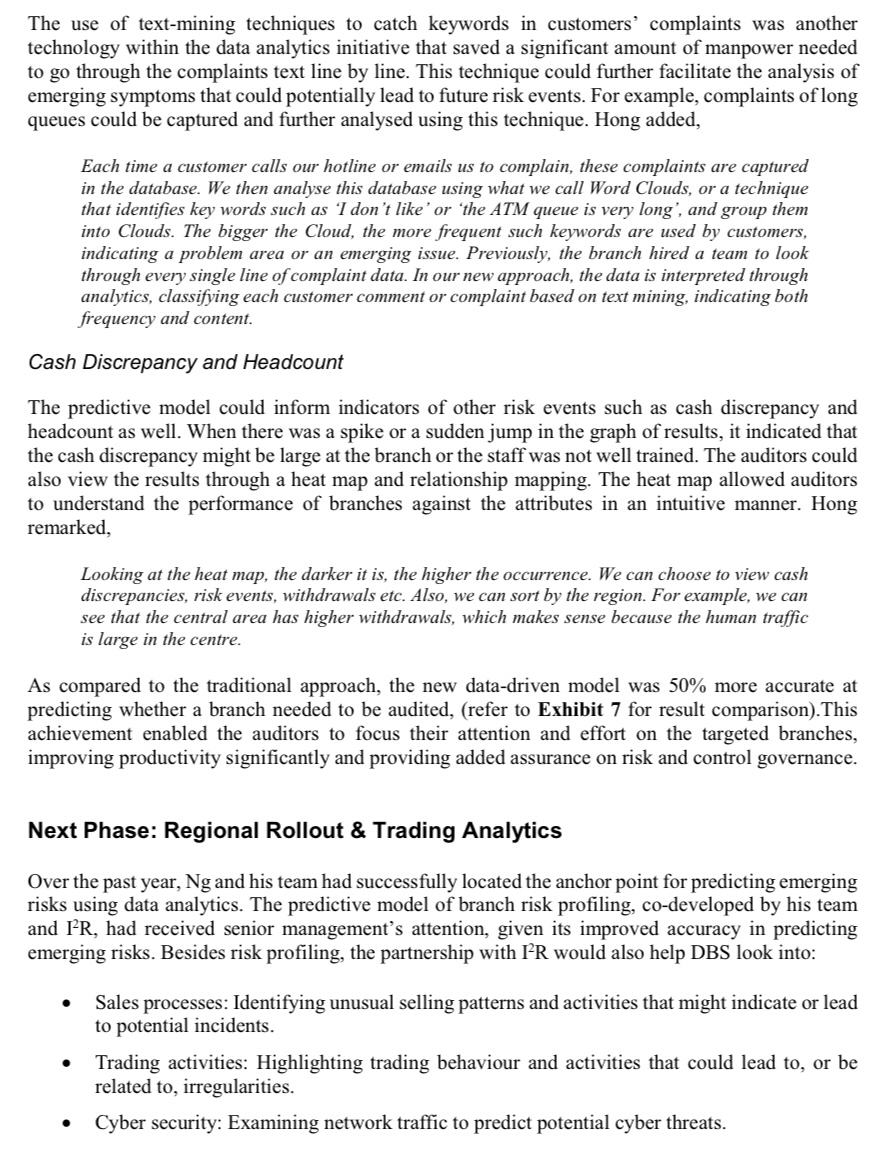
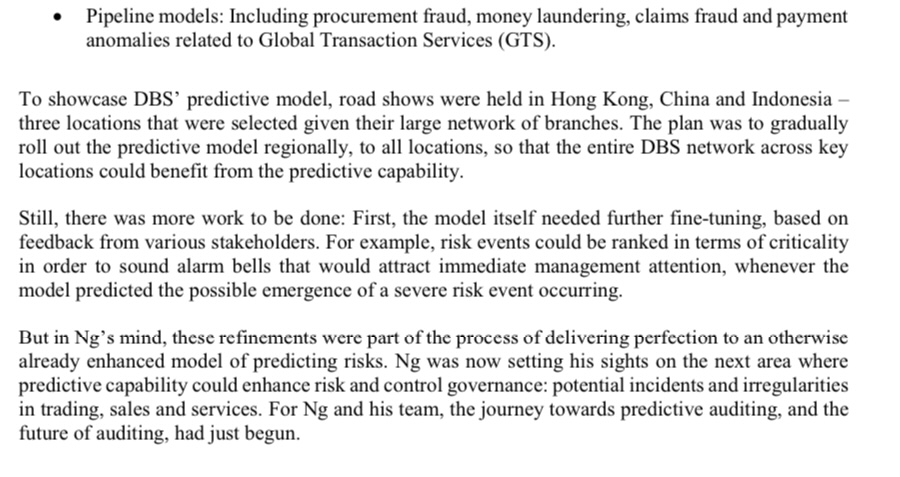
DATA ANALYTICS AT DBS GROUP AUDIT: THE FUTURE OF AUDITING IS AUDITING THE FUTURE Numbers have a convincing story to tell, when you know how to make them work for you. With data analytics, we are able to leverage on statistics and modelling, in order to examine data, to form trends and make predictions about the future. This enables us to adopt a predictive and preventive approach towards auditing - identifying gaps and emerging risks, even before they can become real threats to the bank. Jimmy Ng, Head of Group Audit, DBS On a sunny afternoon in January 2015, Jimmy Ng, Head of Group Audit at DBS Bank, was seated in his office, reflecting on the achievements of his team's data analytics initiative. Over the past year, Group Audit had successfully correlated more than 130 risk-related attributes using a machine- learning predictive modelling technique, compared to a mere seven based on auditors' collective wisdom, used in the previous approach. The new approach had significantly improved the accuracy and effectiveness of risk profiling practices for all the bank's branches. The journey to spearhead the initiative of data analytics started over a year earlier, in January 2014, three months after Ng took over from his predecessor, who had played a key role in leading Group Audit through its evolution to the present day function of integrated risk-based audit. The challenge for Ng however was to take Group Audit to the next frontier - predictive auditing, with the aim of having timely alerts to management on potential risks before they become real threats. This objective was consistent with top management's expectations on Group Audit, as Piyush Gupta, Chief Executive Officer of DBS Group, highlighted, As the third line of defence, Group Audit needs to be at the forefront in being able to (a) highlight emerging risks, and provide insight and foresight on the Bank's risk and control governance (b) flesh out emerging trends, by being able to forecast risks and dangers that lie ahead, in being predictive; (c) flag key risks in a timely manner, so that the necessary actions and manoeuvres can be taken to avoid these lurking dangers. In a nutshell, what I need Group Audit to provide as I grow the business at the Bank is this: timeliness of information and development of emerging issues from the risk & control perspective; insight on what could go wrong, and foresight to prevent things from breaking down. After extensive communication across different functions, and thorough analysis, Ng and his team prioritised revamping the long-adopted risk profiling approach as an anchor point to start the journey of predictive auditing. Traditionally, Group Audit would do a cyclical risk profiling of all the bank's branches in Singapore, and select a sample of these branches to audit over that year. The risk profiling was based on a set of seven criteria, including transaction data, span of control, number of customer complaints, and cash discrepancies, to name a few. These criteria were chosen based on Group Audit's collective years of experience and understanding of how they could impact the riskiness of the branch. Each criterion was then assigned weights, in order to determine the risk rating of theEXHIBIT 3: HIGHER EXPECTATION FROM THREE KEY STAKEHOLDERS Our 3 key stakeholders i.e. Audit Committee, Senior Management & Regulators, have increased their expectation on Group Audit to provide an Added Assurance on the adequacy, effectiveness & completeness of the Bank's internal controls. THE BOARD REGULATORS Senior Management Audit Committee Regulators are asking demands.. wants for Audit to have Timely warnings on Stronger attestation . Wider coverage potential issues of control design and . Higher frequency Emerging threats to be effectiveness . Greater audit depth kept in check . Bigger sampling size In order to meet these increased expectations, there is a need for Group Audit to provide: Wider coverage, by becoming more Productive Greater insights on emerging risks, by deploying Proactive auditing techniques Enhanced foresight on issues even before they GROUP AUDIT emerge through the extensive use of Predictive & Preventive auditing capabilities Source: Company Data. EXHIBIT 4: STRUCTURE OF DATA ANALYTICS Making the transition from hindsight to insight to foresight, in order to move up the value curve in auditing techniques, to be more Predictive & Preventive Predictive & Preventive What will happen? Foresight Forensics Why did it happen? What is happening? Insight Continuous Audit Foundation Traditional Audit HindsightSource: Company Data. EXHIBIT 5: PREDICTIVE ANALYTICS TECHNOLOGY FOR AUDIT Engineering Practice 2. Feature Engineering 1. Data Preparation 3. Training of Model 4. Validation of Model using 5. Live Testing historical data Branch Transaction Data Branch Service Health Check Predictive HRMS Data Analytics Cash Discrepancies Technology Customer Complaints ROR Risk Events Our Innovation Heterogeneous Data Integration Data Visualization Source: Company Data.EXHIBIT 6: THE RISK MAP FOR ALL BRANCHES IN SINGAPORE Johor Bahru Johor Strait join ed Chon Chu King O Sirdiapore pick model 2010 Ap Out 2011 Ap Out 2012 Am Out 2013 Source: Company Data. EXHIBIT 7: PERFORMANCE EVALUATION 1.0 Our technology's accuracy improvement (%) 0.8 0.8 68 0.6 0.6 50 % of Risks Identified 04 0.4 Random 0.2 - Baseline 0.2 Our Model 0 0.0 Random Baseline 0.0 02 0.4 0.6 0.8 1.0 % of Branches Auditedbranches. This method could potentially produce biased results in some cases. For example, some complaint-related risk levels could not be detected accurately and in a timely manner. Prior to initiating any change, Ng thought there were several questions that needed to be addressed. First, how could these criteria be improved or even expanded to include other criteria previously unaccounted for, as good predictors of branch riskiness'? And second, were the weights assigned to each criterion truly reflective of the importance of each criterion? Ng thought aloud, Can we review and enhance our approach, by letting a more diverse data speak for itseif? Can we use data analytics to deveiop a new risk J'Irlodelr that more accurately predicts whethera branch needs to be audited? DBS Bank DBS bank was founded in 1968, three years after Singapore's independence. The bank contributed signicantly to Singapore's industrialisation goal. In 1998, HRS acquired the Post Ofce Savings Bank (POSB) building a solid foundation for its leading position in Singapore.' Over the decades, DBS grew from being a local Singapore bank to a leading Asian bank with more than 250 branches in 18 markets. The bank is today the largest in Southeast Asia, and has been named \"Asia's Best Bank" by The Banker, a member of the Financial Times group, \"Best Bank in Asia- Pacic" by Global Finance, and \"Asian Bank of the Year" by [FR Asia. It has also been recognised as the \"Safest Bank in Asia" for seven consecutive years {2009-2015}. For 2014, DBS reported net prot of US$3.03 billion, a 10% increase over the previous year. Core net prot rose 10% to US$ 2.9 billion. The total income rose 8% to US$ 'i'.2 billion led by growth in the Consumer Banking, Wealth Management and Institutional Banking businesses.2 Group Audit At DBS, Group Audit was an entity that was independent of the activities it audited. It evaluated the bank's risk management and internal control systems in terms of reliability, adequacy and effectiveness. Group Audit reviewed the appropriate steps taken by the bank in addressing control deciencies. The primary objective of Group Audit was to ensure the bank's senior management and board of directors adhered to DBS's strategic and operational goals. The Evolution of Group Audit Before 2004, Group Audit adopted the conventional audit approach, which was primarily checklist- based and focused on operational processes. From 2004 to 2008, it transformed into a risk-based approach that provided continuous audit monitoring and engagement. It implemented practices such as cross-unit risk control learning, which involved mutual learning about risks and controls among di'crent units, and sharing experiences and best practices on controlling risks. However, this risk- based approach only adopted basic Computer Assisted Audit Techniques {CAATs} and did not connect with other risk review functions. From 2009 to 2012, led by Ng's predecessor, Group Audit transformed into integrated risk-based audit rnctions, which achieved integration with other risk review functions to ensure end-to-end audit coverage (refer to Exhibit 1 for evolution of Group Audit}.3 But the new vision of predictive auditing set by top management impelled Group Audit to transfonrr again, with more focus on minimising risks. The plan was to equip the bank with enhanced data analytics capabilities in audit (refer to Exhibit 2 and Exhibit 3 for audit mission statement and stakeholders' expectations). Future of Auditing initiative - Predictive Auditing Traditionally, Group Audit evaluated the risks for all the auditable entities in DBS by applying the Audit Risk Assessment (ARA) methodology to determine the frequency of the audit for each entity - annually, 2-year, 3-year or 4-year cycle. Group Audit also helped the consumer banking business unit form their own health check teams, which would effectively examine each branch \"a compliance with established sales and service procedures, thereby enabling the management to reinforce supervisory monitoring over the branches. With the new vision, Group Audit decided to roll out the future of auditing initiative, changing the paradigm in DBS's approach towards providing awareness of emerging risks on intental controls of DBS. The two key components of the future auditing initiative were proactive auditing and predictive auditing. Proactive auditing was an approach that provided a continuous assessment of the controls environment. This was achieved through auditing project implementation for large programme initiatives, and identifying key potential issues before real risks caused emergencies. Group Audit had adopted extensive use of CAATs to automate the audit test steps. Predictive auditing was an approach that provided an assessment of the risk and controls environment that are likely to occur in the near future. This was achieved by leveraging on data analytics and machine learning predictive modelling techniques to sift through the large quantity of data in order to identify trends, such as how high staff turnover at the branch could impact intental controls, and make predictions about the rture. With this foresight, Group Audit could provide timely alerts to management, through various risk and control forums, on potential risk events before they occurred, and enable the implementation of preventive measures.4 For example, the predictive modelling technique involved an ensemble model that incorporated logistic regression, random forest and gradient boosting to the analysis of associations and atnibutions beMeen data variables. In laymen terms, this involved taking measurements of multiple atnibutes of branches, and studying correlations betiveen these attributes and the likelihood of risk events within these branches. After a proeess of data cnrnching, these correlations were distilled into a data model that profiled the risk score of each branch, which in turn facilitated the selection of branches for audit. Data Analytics for Predictive Auditing The Existing Approach of Risk Profiling Ng believed the prediction of risk levels in the bank presented a great opportunity for applying data analytics (refer to Exhibit 4 for structure of data analytics), and commented, "Adopting data analytics would lay down a solid foundation to the vision of predictive auditing." Ng and his team scrutinised the existing auditing practices, and began revamping the risk profiling approach for branches. This enabled the auditing team to decide which branch should be audited based on its level of risk. The risk profiling was previously based on a certain set of criteria, which was selected based on prior experience and understanding of how these criteria could impact the risk levels of the branch. Not only did this involve the auditors spending considerable time and effort on completing the selection process manually, but also resulted in the selections being prone to human error and potential bias due to lack of scientific measures. As Hong Wenzheng, Vice President of the Data Analytics & Automation Revolution Team (DAART) at DBS Group Audit, remarked, In the past, our auditors have had to audit branch by branch. Before they went down to the branch, they had to manually review a list of transactions by from the transaction log. By applying data analytics, the auditors would save many man-hours in doing the same check. Furthermore, the quality of sampling was an issue as well, added Yik Yeng Yee, Audit-Chief Operating Officer at Group Audit, We normally do the audit by products. So if we want to audit deposit products, we will audit the framework, the product itself-such as fixed deposit and current accounts, and review the risks and controls end-to-end, including those at the branches. We will pick a few branches to audit by using qualitative and quantitative methods based on the seven criteria framework. So these were very experience-based, not truly scientific in methodology and approach. The Solution With the aim of heightening branch risk profiling, in February 2014, DBS Group Audit and A* STAR's Institute for Infocomm Research (PR) established an agreement to set up a joint lab, leveraging the research institute's capabilities in developing new and innovative products and services. "A*STAR was a lead public sector agency in Singapore that spearheaded economic-oriented research to advance scientific discovery and develop innovative technology.' Working with PR, Group Audit would develop a predictive model that performed the analysis of associations and attributions between data variables. This model would include measures of multiple attributes from branches, and research correlations between these attributes, thereby projecting the likelihood of riskevents within these branches. After a process of data crunching, these correlations were distilled into a data model that profiled the risk score of each branch, which in turn, facilitated the selection of branches for audit. The process of predicting emerging risks at DBS followed three steps. First, the data preparation process would gather raw data from multiple resources, which included branch transaction data, branch service health check, cash discrepancies, customer complaints and other risk events. Second, the data analytics team would run multiple models to receive the outputs of data analysis. Validation of models using historical data would be performed to ensure the model's accuracy. Third, live testing would take place to understand and visualise the outputs in heat-map formats, which highlighted results based on varying degrees of attributes. The final outputs would provide insightful details for auditors to understand the riskiness in all branches (refer to Exhibit 5 for analytics process). Data Analytics and Branch Risk Profiling- The Outcome The initiative reached a significant milestone 12 months after the project started. The new data-driven model successfully correlated more than 130 attributes with the risk score, compared to a mere seven used in the previous approach. At the click of a button in the programme, the outputs would be presented in graph-based formats demonstrating the status of branches in terms of risk levels and complaint analyses. Hong commented, The new model came up with many more attributes, which were found to be correlated with the risk score, whether or not there were risk events at a particular branch. It was a big achievement because we moved from seven attributes to 130 attributes. These attributes included cash discrepancies, headcount, HR accounts, and many others, that would give a more precise prediction on the riskiness of the branches - something which experience and collective wisdom might not have accurately captured. The Heat Map The predictive models would provide outputs with a heat map, which revealed the risk level of all branches in Singapore from a birds-eye perspective. Branches considered high-risk were indicated in red on the heat map. Those marked yellow were regarded as medium-risk. Green represented low- risk branches (refer to Exhibit 6 for heat map). The auditors were then able to visualise the riskiness of all branches easily and accurately, and could also follow up with specific actions on those branches marked as medium-high risks. Besides the highlights of risky branches, the generated heat map further indicated which business area of a particular branch required more attention. For example, if the heat map showed a high level of cash discrepancy in a branch, then auditors could deep dive into the transaction records of that branch to investigate and identify the root cause of the discrepancy. This significantly reduced the need for manpower to manually go through the tedious process of looking for abnormal details. Complaint AnalysisThe use of text-mining techniques to catch keywords in customers' complaints was another technology within the data analytics initiative that saved a significant amount of manpower needed to go through the complaints text line by line. This technique could further facilitate the analysis of emerging symptoms that could potentially lead to future risk events. For example, complaints of long queues could be captured and further analysed using this technique. Hong added, Each time a customer calls our hotline or emails us to complain, these complaints are captured in the database. We then analyse this database using what we call Word Clouds, or a technique that identifies key words such as "I don't like' or 'the ATM queue is very long', and group them into Clouds. The bigger the Cloud, the more frequent such keywords are used by customers, indicating a problem area or an emerging issue. Previously, the branch hired a team to look through every single line of complaint data. In our new approach, the data is interpreted through analytics, classifying each customer comment or complaint based on text mining, indicating both frequency and content. Cash Discrepancy and Headcount The predictive model could inform indicators of other risk events such as cash discrepancy and headcount as well. When there was a spike or a sudden jump in the graph of results, it indicated that the cash discrepancy might be large at the branch or the staff was not well trained. The auditors could also view the results through a heat map and relationship mapping. The heat map allowed auditors to understand the performance of branches against the attributes in an intuitive manner. Hong remarked, Looking at the heat map, the darker it is, the higher the occurrence. We can choose to view cash discrepancies, risk events, withdrawals etc. Also, we can sort by the region. For example, we can see that the central area has higher withdrawals, which makes sense because the human traffic is large in the centre. As compared to the traditional approach, the new data-driven model was 50% more accurate at predicting whether a branch needed to be audited, (refer to Exhibit 7 for result comparison). This achievement enabled the auditors to focus their attention and effort on the targeted branches, improving productivity significantly and providing added assurance on risk and control governance. Next Phase: Regional Rollout & Trading Analytics Over the past year, Ng and his team had successfully located the anchor point for predicting emerging risks using data analytics. The predictive model of branch risk profiling, co-developed by his team and I-R, had received senior management's attention, given its improved accuracy in predicting emerging risks. Besides risk profiling, the partnership with P'R would also help DBS look into: . Sales processes: Identifying unusual selling patterns and activities that might indicate or lead to potential incidents. . Trading activities: Highlighting trading behaviour and activities that could lead to, or be related to, irregularities. Cyber security: Examining network traffic to predict potential cyber threats.o Pipeline models: Including procurement 'aud, money laundering, claims fraud and payment anomalies related to Global Transaction Services (GT3). To showcase DBS' predictive model, road shows were held in Hong Kong, China and Indonesia three locations that were selected given their large network of branches. The plan was to gradually roll out the predictive model regionally, to all locations, so that the entire DES network across key locations could benet from the predictive capability. Still, there was more work to be done: First, the model itself needed u'ther ne-timing, based on feedback from various stakeholders. For example, risk events could be ranked in terms of criticality in order to sound alarm bells that would attract immediate management attention, whenever the model predicted the possible emergence of a severe risk event occurring. But in Ng's mind, these renements were part of the process ofdclivcring perfection to an otherwise already enhanced model of predicting risks. Hg was now setting his sights on the next area where predictive capability could enhance risk and control governance: potential incidents and irregularities in trading, sales and services. For Ng and his team, the journey towards predictive auditing, and the future of auditing, had just begun. EXHIBIT 1: THE EVOLUTION OF GROUP AUDIT The Evolution Of Group Audit Thought Leaders, Cutting Edge Practice, Industry Benchmark Before 2004 2004 to 2008 2009 to 2012 2013 Onwards Primarily checklist Transformation to Integration with other . Productive based; focus was on risk based risk review functions to enhancing efficiency & operational processes; . Continuous audit ensure end to end effectiveness, not necessarily risks monitoring and audit coverage channeling auditing Periodic audits engagement Encourage more in resources to more point in time checks "In business control business control value adding activities " Minimal, if any, risk functions began to functions to drive . Proactive auditing frameworks to align form business greater business on the go, as it with ownership facilitating ownership and happens, moving from accountability hindsight to foresight * In business control auditreliance functions notclearly * Corporate control . Closer coordination " Predictive mapping defined functions/risk agents with corporate control trends to forecastand identify emerging risks Corporate control established; butlittle functions/ risk agents functions / risk agents coordination with Audit to break silos and " Preventive using not well established * Automation of audit derive synergies data analytics to . Paper based audits process . More sophisticated preventincidents from usage of CAATS happening Conventional Audit Risk-Based Audit Integrated Risk-Based Audit Predictive Auditing Continuously taking auditing to the next level... Source: Company Data.EXHIBIT 2: AUDIT MISSION STATEMENT Our Purpose Statement AUDIT We strive to bring an independent voice of reason to provide the board, management & regulators with objective assurance, balanced perspective & insight, by being Productive, Proactive, Predictive & Preventive to enable DBS to achieve its objectives. int XDBS Source: Company Data
Step by Step Solution
There are 3 Steps involved in it
1 Expert Approved Answer
Step: 1 Unlock
Question Has Been Solved by an Expert!
Get step-by-step solutions from verified subject matter experts
Step: 2 Unlock
Step: 3 Unlock
Students Have Also Explored These Related Accounting Questions!