Question
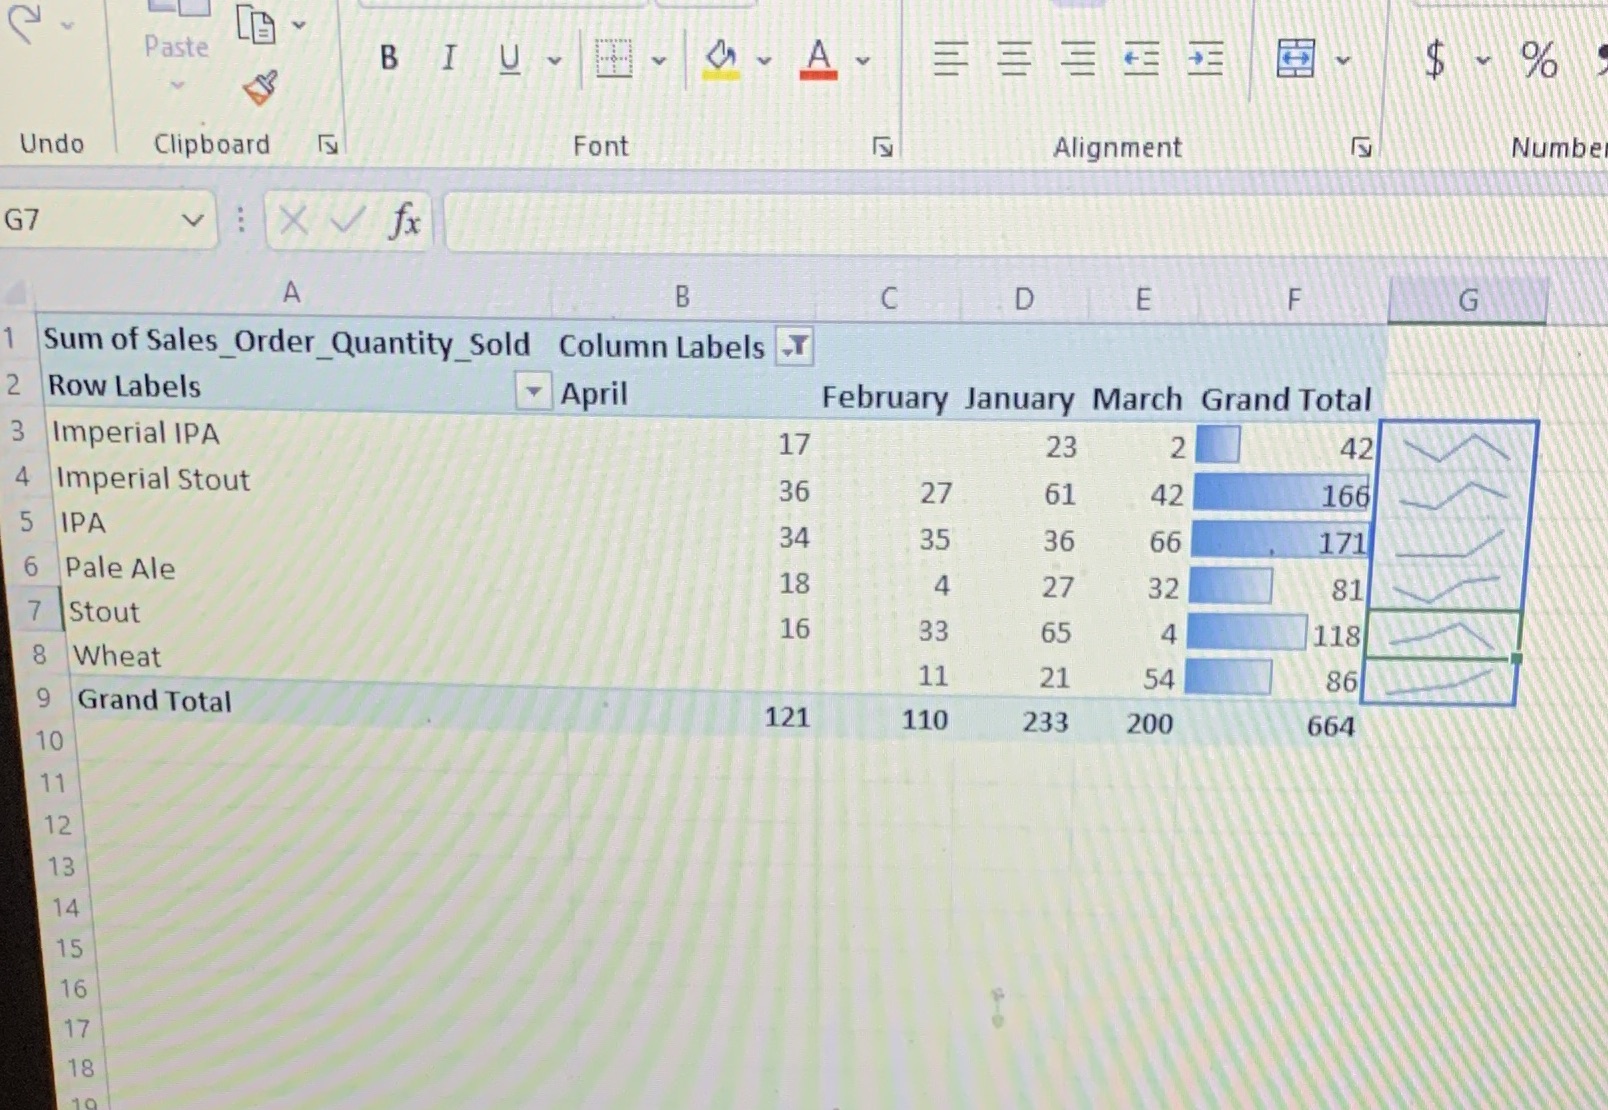
Data analytics for accounting. Lab 4-1Q1. Spend a few minutes filtering the data with slicers. Name three important insights that were easy to identify through
Data analytics for accounting. Lab 4-1Q1. Spend a few minutes filtering the data with slicers. Name three important insights that were easy to identify through this visualization .Q2. What does the data visualization and the interactivity of the slicer provide your audience that the original pivotTable does not? Q3. Web do you think a sparkle line and / or conditional formatting would be preferable over creating a pivotchart?Q4. What other visualization would be useful to interpret these data? If you were to create a report to be run monthly, what are two visualization that should be included?Q5. Provide a written report discussing the data analysis project and insights that should be gained from this visualization.

Step by Step Solution
There are 3 Steps involved in it
Step: 1

Get Instant Access to Expert-Tailored Solutions
See step-by-step solutions with expert insights and AI powered tools for academic success
Step: 2

Step: 3

Ace Your Homework with AI
Get the answers you need in no time with our AI-driven, step-by-step assistance
Get Started


