Answered step by step
Verified Expert Solution
Question
1 Approved Answer
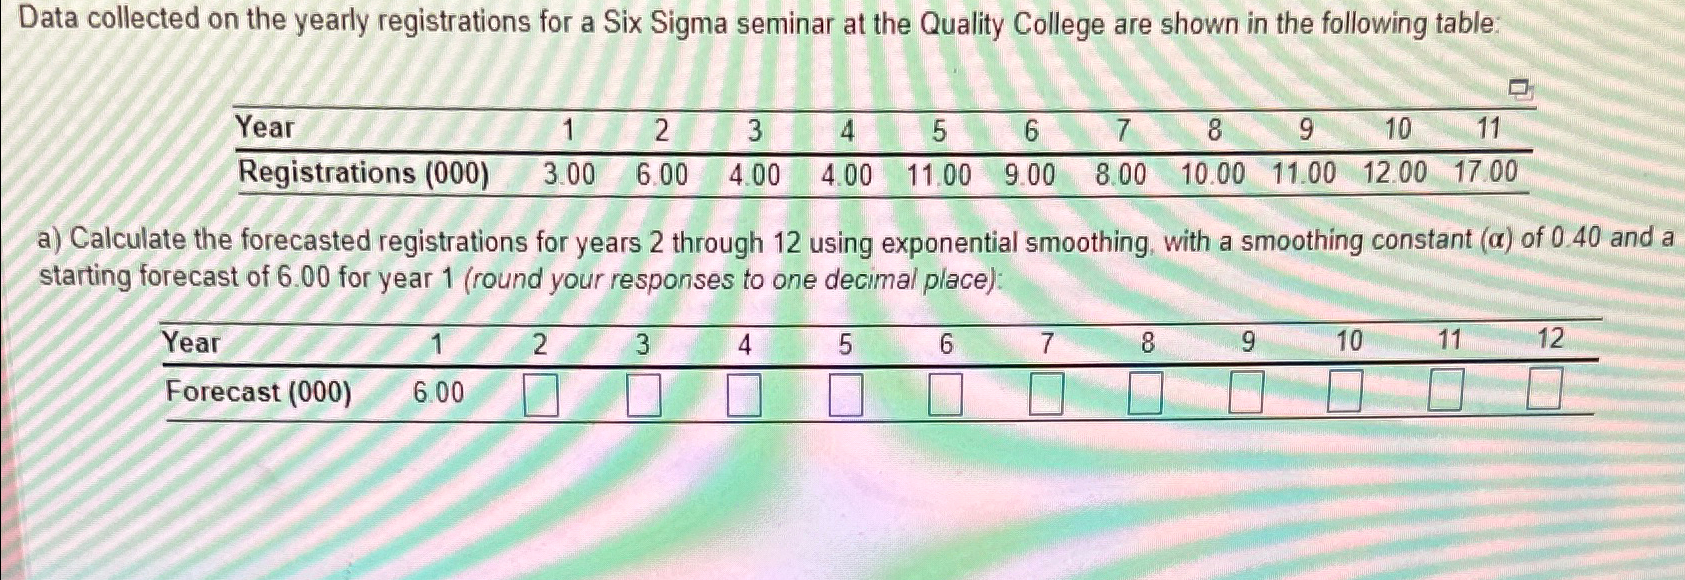
Data collected on the yearly registrations for a Six Sigma seminar at the Quality College are shown in the following table: table [ [
Data collected on the yearly registrations for a Six Sigma seminar at the Quality College are shown in the following table:
tableYearRegistrations
a Calculate the forecasted registrations for years through using exponential smoothing, with a smoothing constant of and a starting forecast of for year round your responses to one decimal place:

Step by Step Solution
There are 3 Steps involved in it
Step: 1

Get Instant Access to Expert-Tailored Solutions
See step-by-step solutions with expert insights and AI powered tools for academic success
Step: 2

Step: 3

Ace Your Homework with AI
Get the answers you need in no time with our AI-driven, step-by-step assistance
Get Started


