

Question
data for a simple random sample of 100 people without cardiovascular disease at enrolment. At enrollment, total cholesterol was measured. Total cholesterol levels were tracked
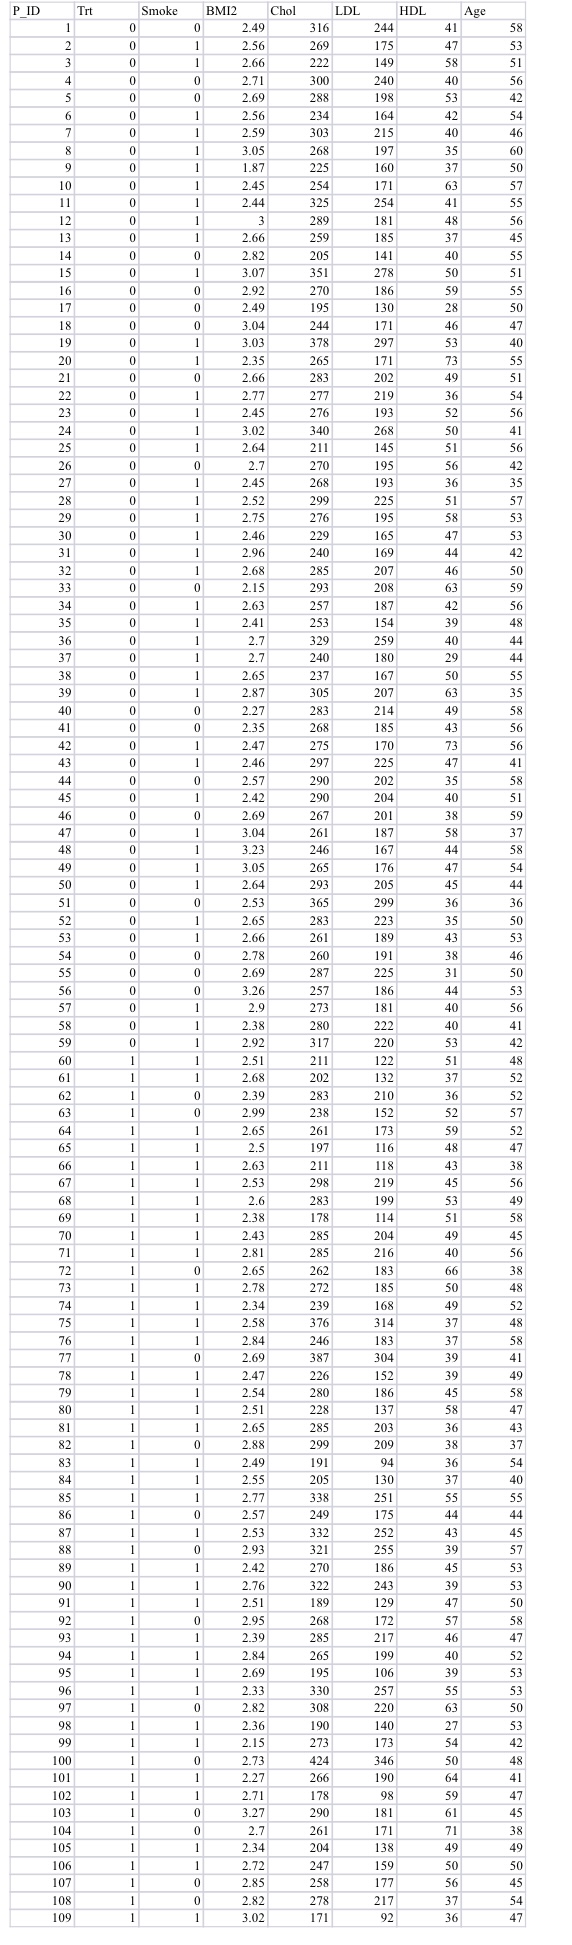
data for a simple random sample of 100 people without cardiovascular disease at enrolment. At enrollment, total cholesterol was measured. Total cholesterol levels were tracked for 10 years to determine if they predicted CHD events. One cohort member per row. Variables in this data include: ?Part_id: Participant ID (1 to 100) Gender: Subject gender ("M" or "F") ?Age: Subject age (years) ?Chol: Total cholesterol level (mg/dL) at enrollment ?CHD: Indicator of CHD event (1= CHD event, 0 = no CHD event) at year 10 Investigators want to compare the average total cholesterol values (Chol) of people with and without CHD events to see if they differ. A) show and draw the null and alternative hypotheses for this situation. Hypothesis test assumptions. Assumptions met? Briefly explain. Should cholesterol readings be regularly distributed? Is this problem normally distributed? Briefly explain. B) Give each group's average cholesterol. Hypothesis test statistics. Show some intermediate steps and relevant computer output. Calculate p. Specify degrees of freedom. C) interpret in context the Non-statisticians should use the p-value as a probability. Do the two populations' average total cholesterol values match? Any conclusions?
Step by Step Solution
There are 3 Steps involved in it
Step: 1

Get Instant Access to Expert-Tailored Solutions
See step-by-step solutions with expert insights and AI powered tools for academic success
Step: 2

Step: 3
Ace Your Homework with AI
Get the answers you need in no time with our AI-driven, step-by-step assistance
Get Started