

Answered step by step
Verified Expert Solution
Question
1 Approved Answer
Data Mining: I've tried this problem a couple of times and keep getting errors even with other chegg experts help. Can you show how to
Data Mining: I've tried this problem a couple of times and keep getting errors even with other chegg experts help. Can you show how to code this using R studio? Start to Finish MAKE SURE TO TEST IT IN R yourself! Data Mining
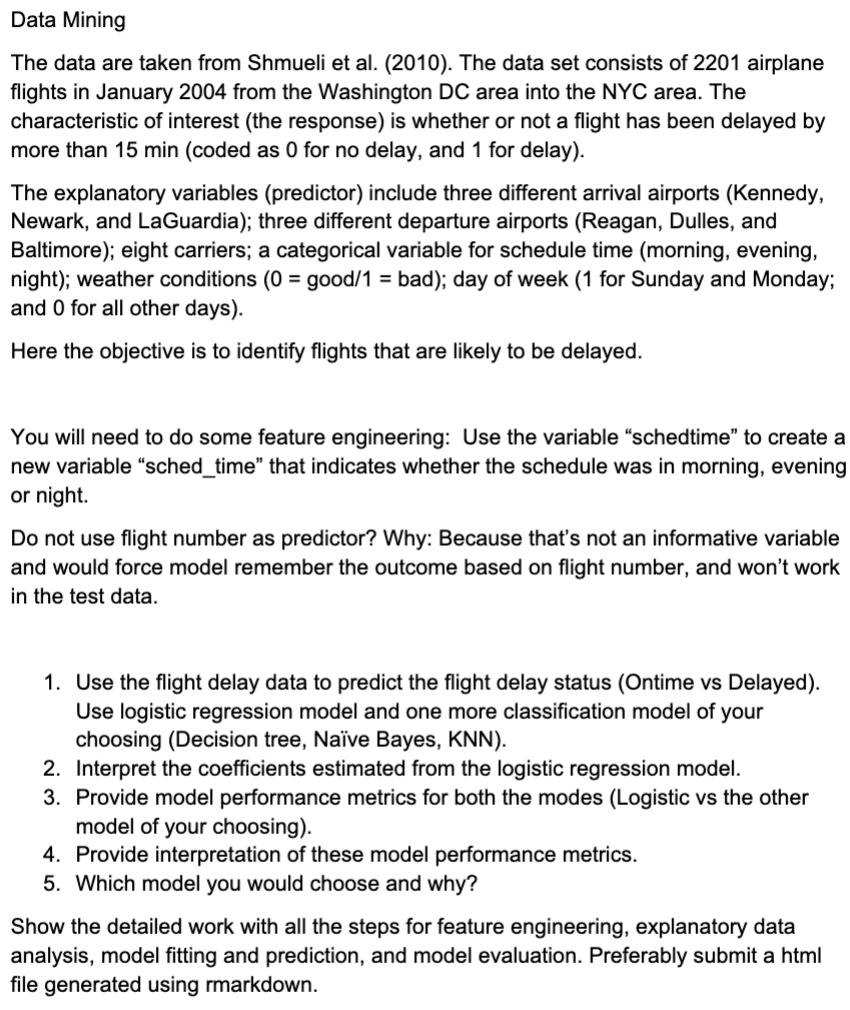
The data are taken from Shmueli et al The data set consists of airplane
flights in January from the Washington DC area into the NYC area. The
characteristic of interest the response is whether or not a flight has been delayed by
more than min coded as for no delay, and for delay
The explanatory variables predictor include three different arrival airports Kennedy
Newark, and LaGuardia; three different departure airports Reagan Dulles, and
Baltimore; eight carriers; a categorical variable for schedule time morning evening,
night; weather conditions good bad; day of week for Sunday and Monday;
and for all other days
Here the objective is to identify flights that are likely to be delayed.
You will need to do some feature engineering: Use the variable "schedtime" to create a
new variable "schedtime" that indicates whether the schedule was in morning, evening
or night.
Do not use flight number as predictor? Why: Because that's not an informative variable
and would force model remember the outcome based on flight number, and won't work
in the test data.
Use the flight delay data to predict the flight delay status Ontime vs Delayed
Use logistic regression model and one more classification model of your
choosing Decision tree, Nave Bayes, KNN pick the easiest one!
Interpret the coefficients estimated from the logistic regression model.
Provide model performance metrics for both the modes Logistic vs the other model
Provide interpretation of these model performance metrics.
Which model you would choose and why?
Show the detailed work with all the steps for feature engineering, explanatory data
analysis, model fitting and prediction, and model evaluation. Preferably submit a html
file generated using rmarkdown.
Data Categories in data set that im using are as follows: "schedtime", "carrier", "deptime", "dest", "distance", "date", "flightnumber", "origin", "weather", "dayweek", "daymonth", "tailnu", and "delay"
Step by Step Solution
There are 3 Steps involved in it
Step: 1

Get Instant Access to Expert-Tailored Solutions
See step-by-step solutions with expert insights and AI powered tools for academic success
Step: 2

Step: 3
Ace Your Homework with AI
Get the answers you need in no time with our AI-driven, step-by-step assistance
Get Started
Machine Learning And Knowledge Discovery In Databases European Conference Ecml Pkdd 2010 Barcelona Spain September 2010 Proceedings Part 2 Lnai 6322
Authors: Jose L. Balcazar ,Francesco Bonchi ,Aristides Gionis ,Michele Sebag
2010th Edition
364215882X, 978-3642158827