Answered step by step
Verified Expert Solution
Link Copied!

Question

1 Approved Answer

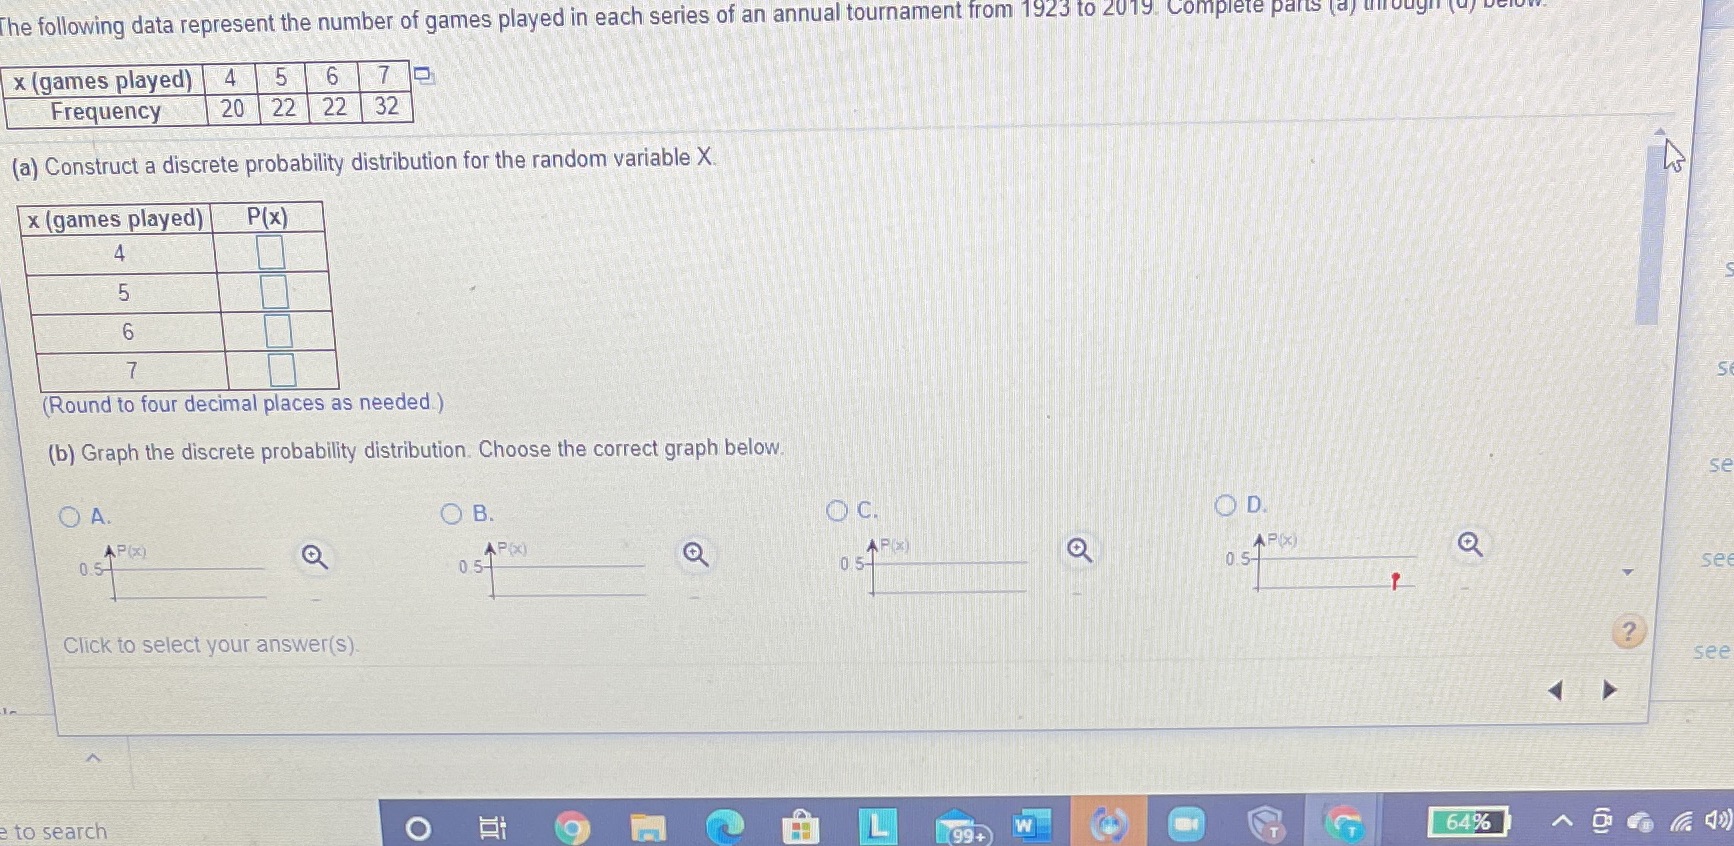
Data represent The following data represent the number of games played in each series of an annual tournament from 1923 to 2019. Complete parts a

Data represent

image text in transcribed
The following data represent the number of games played in each series of an annual tournament from 1923 to 2019. Complete parts a ullo x (games played) 4 5 6 7 Frequency 20 22 22 32 (a) Construct a discrete probability distribution for the random variable X. x (games played) P(x) 4 5 6 7 (Round to four decimal places as needed ) (b) Graph the discrete probability distribution. Choose the correct graph below. O A. O B. se OC. OD. AP(X) 0.57 057 057 see Click to select your answer(s) ? see e to search OHRAL 199+ W G 64%

Step by Step Solution

There are 3 Steps involved in it

Step: 1

blur-text-image

Get Instant Access to Expert-Tailored Solutions

See step-by-step solutions with expert insights and AI powered tools for academic success

Step: 2

blur-text-image

Step: 3

blur-text-image

Ace Your Homework with AI

Get the answers you need in no time with our AI-driven, step-by-step assistance

Get Started

Recommended Textbook for

Finite Math And Applied Calculus

Authors: Stefan Waner, Steven Costenoble

6th Edition

1285415132, 9781285415130

More Books

Students also viewed these Mathematics questions

Question

How can the grocery store you use improve its inventory management?

Answered: 1 week ago