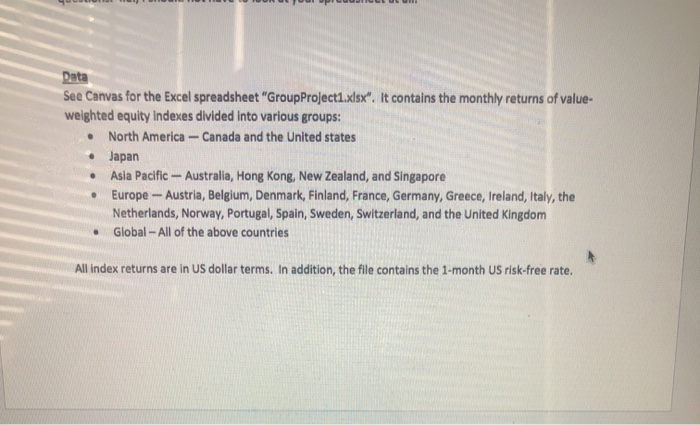
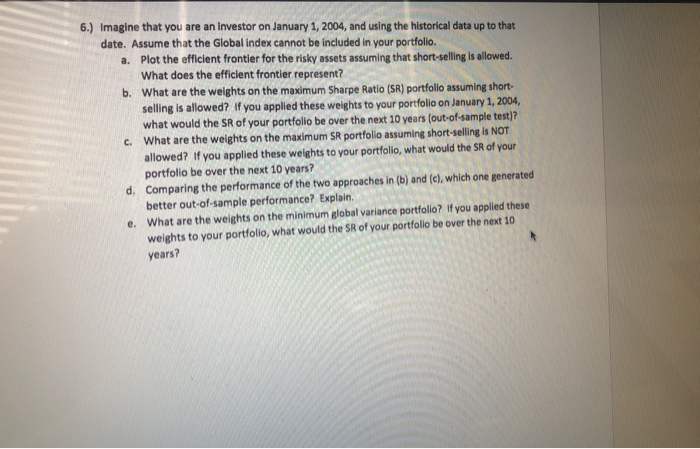
Data See Canvas for the Excel spreadsheet "GroupProject1.xlsx". It contains the monthly returns of value- weighted equity Indexes divided into various groups: North America - Canada and the United states Japan Asia Pacific - Australia, Hong Kong, New Zealand, and Singapore Europe - Austria, Belgium, Denmark, Finland, France, Germany, Greece, Ireland, Italy, the Netherlands, Norway, Portugal, Spain, Sweden, Switzerland, and the United Kingdom Global - All of the above countries All index returns are in US dollar terms. In addition, the file contains the 1-month US risk-free rate. 6.) Imagine that you are an investor on January 1, 2004, and using the historical data up to that date. Assume that the Global Index cannot be included in your portfolio. a. Plot the officient frontier for the risky assets assuming that short-selling is allowed. What does the efficient frontier represent? b. What are the weights on the maximum Sharpe Ratio (SR) portfolio assuming short selling is allowed? If you applied these weights to your portfolio on January 1, 2004, what would the SR of your portfolio be over the next 10 years (out-of-sample test)? What are the weights on the maximum SR portfolio assuming short-selling is NOT allowed? If you applied these weights to your portfolio, what would the SR of your portfolio be over the next 10 years? d. Comparing the performance of the two approaches in (b) and (c), which one generated better out-of-sample performance? Explain. e. What are the weights on the minimum global variance portfolio? If you applied these weights to your portfolio, what would the SR of your portfolio be over the next 10 years? Data See Canvas for the Excel spreadsheet "GroupProject1.xlsx". It contains the monthly returns of value- weighted equity Indexes divided into various groups: North America - Canada and the United states Japan Asia Pacific - Australia, Hong Kong, New Zealand, and Singapore Europe - Austria, Belgium, Denmark, Finland, France, Germany, Greece, Ireland, Italy, the Netherlands, Norway, Portugal, Spain, Sweden, Switzerland, and the United Kingdom Global - All of the above countries All index returns are in US dollar terms. In addition, the file contains the 1-month US risk-free rate. 6.) Imagine that you are an investor on January 1, 2004, and using the historical data up to that date. Assume that the Global Index cannot be included in your portfolio. a. Plot the officient frontier for the risky assets assuming that short-selling is allowed. What does the efficient frontier represent? b. What are the weights on the maximum Sharpe Ratio (SR) portfolio assuming short selling is allowed? If you applied these weights to your portfolio on January 1, 2004, what would the SR of your portfolio be over the next 10 years (out-of-sample test)? What are the weights on the maximum SR portfolio assuming short-selling is NOT allowed? If you applied these weights to your portfolio, what would the SR of your portfolio be over the next 10 years? d. Comparing the performance of the two approaches in (b) and (c), which one generated better out-of-sample performance? Explain. e. What are the weights on the minimum global variance portfolio? If you applied these weights to your portfolio, what would the SR of your portfolio be over the next 10 years


