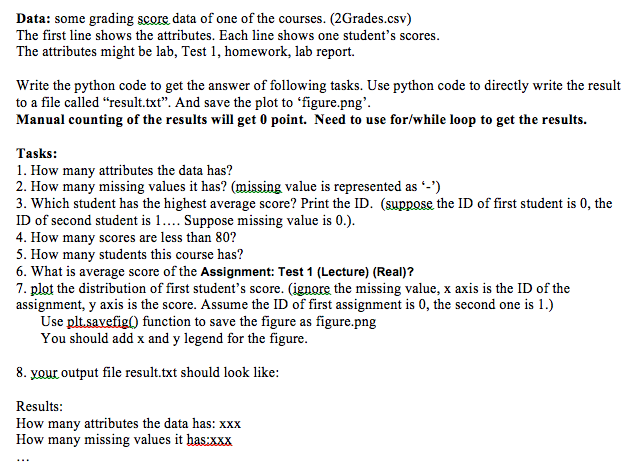
Data: some grading score data of one of the courses. (2Grades.csv) The first line shows the attributes. Each line shows one student's scores The attributes might be lab, Test 1, homework, lab report Write the python code to get the answer of following tasks. Use python code to directly write the result to a file called "result.txt". And save the plot to 'figure.png' Manual counting of the results will get 0 point. Need to use for/while loop to get the results. Tasks: 1. How many attributes the data has? 2. How many missing values it has? (missing value is represented as -') 3. Which student has the highest average score? Print the ID. (suppose the ID of first student is 0, the ID of second student is 1.... Suppose missing value is 0.) 4. How many scores are less than 80? 5. How many students this course has? 6. What is average score of the Assignment: Test 1 (Lecture) (Real)? 7. plot the distribution of first student's score. (ignore the missing value, x axis is the ID of the assignment, y axis is the score. Assume the ID of first assignment is 0, the second one is 1.) Use plt.savefig() function to save the figure as figure.png You should add x and y legend for the figure 8. you output file result.txt should look like: Results How many attributes the data has: xxx How many missing values it has:xxx Data: some grading score data of one of the courses. (2Grades.csv) The first line shows the attributes. Each line shows one student's scores The attributes might be lab, Test 1, homework, lab report Write the python code to get the answer of following tasks. Use python code to directly write the result to a file called "result.txt". And save the plot to 'figure.png' Manual counting of the results will get 0 point. Need to use for/while loop to get the results. Tasks: 1. How many attributes the data has? 2. How many missing values it has? (missing value is represented as -') 3. Which student has the highest average score? Print the ID. (suppose the ID of first student is 0, the ID of second student is 1.... Suppose missing value is 0.) 4. How many scores are less than 80? 5. How many students this course has? 6. What is average score of the Assignment: Test 1 (Lecture) (Real)? 7. plot the distribution of first student's score. (ignore the missing value, x axis is the ID of the assignment, y axis is the score. Assume the ID of first assignment is 0, the second one is 1.) Use plt.savefig() function to save the figure as figure.png You should add x and y legend for the figure 8. you output file result.txt should look like: Results How many attributes the data has: xxx How many missing values it has:xxx