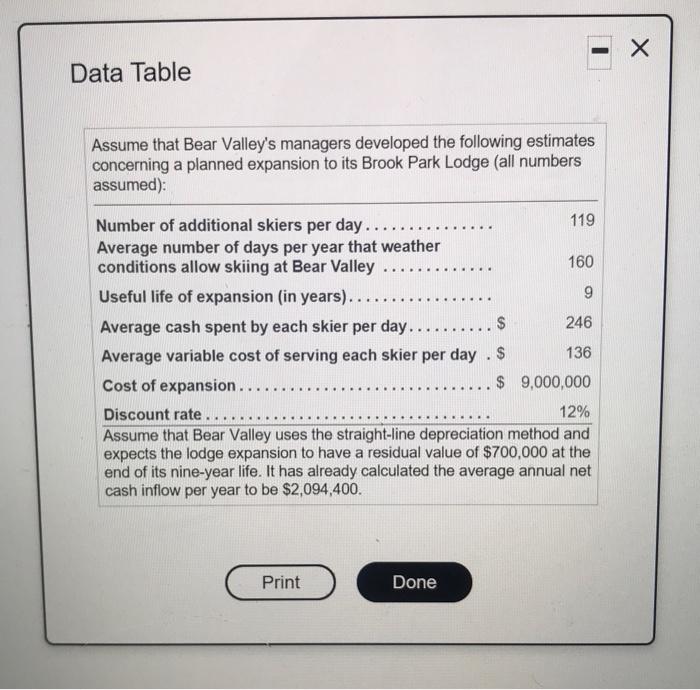
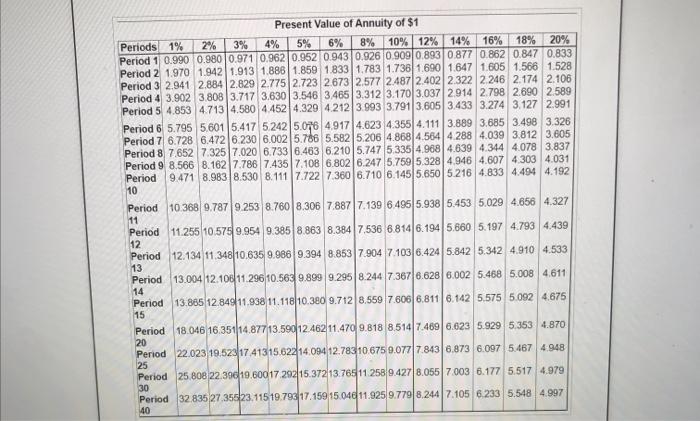
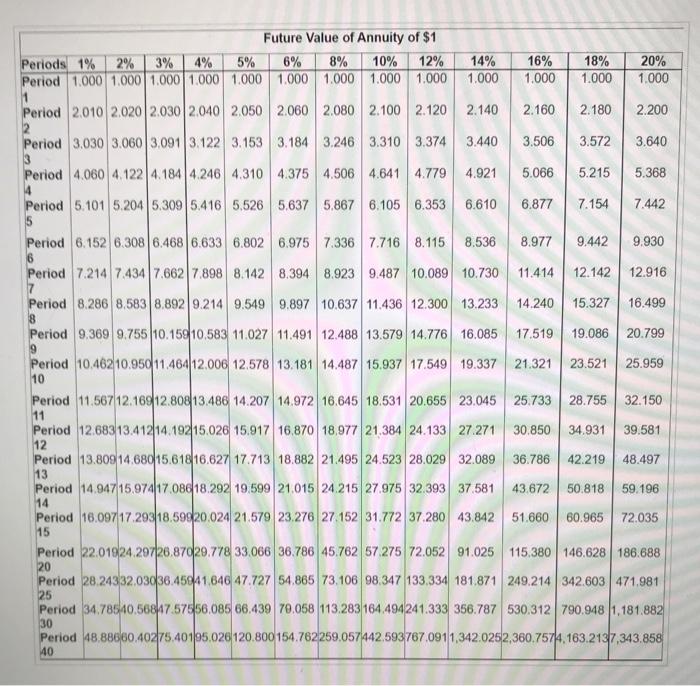
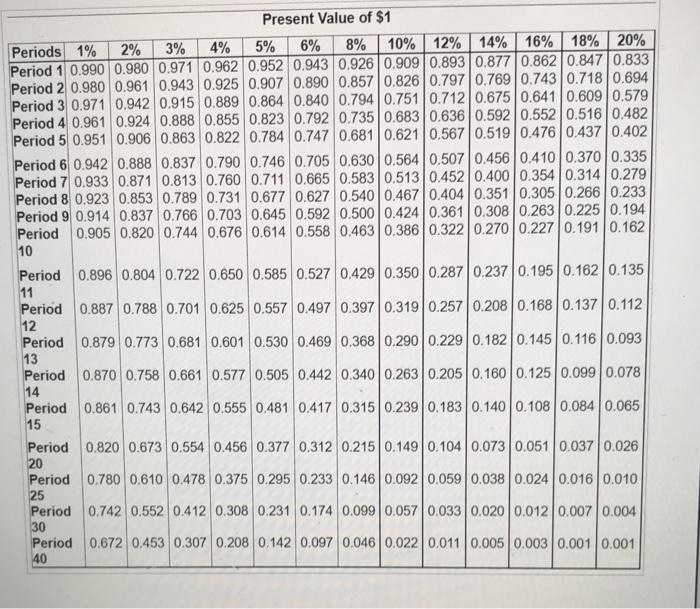
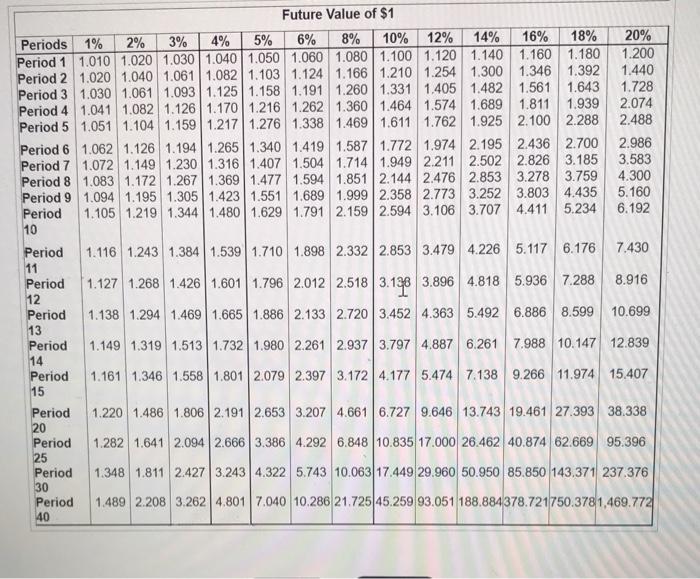
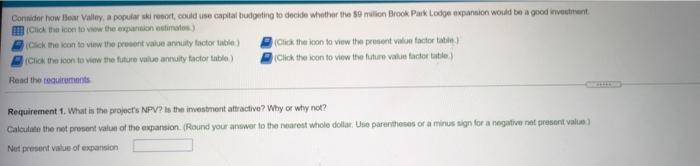
Data Table Assume that Bear Valley's managers developed the following estimates concerning a planned expansion to its Brook Park Lodge (all numbers assumed): . - Number of additional skiers per day ..., 119 Average number of days per year that weather conditions allow skiing at Bear Valley 160 Useful life of expansion (in years).... 9 Average cash spent by each skier per day..... $ 246 Average variable cost of serving each skier per day . $ 136 Cost of expansion... $ 9,000,000 Discount rate 12% Assume that Bear Valley uses the straight-line depreciation method and expects the lodge expansion to have a residual value of $700,000 at the end of its nine-year life. It has already calculated the average annual net cash inflow per year to be $2,094,400. ... Print Done Present Value of Annuity of $1 Periods 1% 2% 3% 4% 5% 6% 8% 10% 12% 14% 16% 18% 20% Period 1 0.990 0.980 0.971 0.962 0.952 0.943 0.926 0.909 0.893 0877 0.862 0.847 0.833 Period 2 1.970 1.942 1.913 1.8881.859 1.833 1.783 1.738 1.690 1.647 1.605 1.566 1.528 Period 3 2.941 28842.829 2.775 2.723 2.6732,577 2.487 2.402 2322 2.246 2.174 2.106 Period 4 3.902 3.808 3.717 3,630 3.546 3465 3.312 3.170 3,037 2.914 2.798 2.690 2589 Period 5 4.853 4.713 4.580 4.452 4.329 4212 3.993 3.791 3,605 3.433 3.274 3.127 2.991 Period 6 5.795 5.601 5.417 5242 5.076 4,917 4.623 4.355 4.111 3.889 3.685 3.498 3.326 Period 7 6.728 6.472 6.230 6.002 5.786 5.5825.206 4.868|4,564 4288 4.039 3.812 3.605 Period 8 7.652 7.325 7.020 6.7336.463 6.210 5.747 5.335 4.968 4.639 4.344 4.078 3.837 Period 9 8.566 8. 162 7.786 7435 7.108 6.8026.247 5.759 5.328 4.946 4.607 4.303 4.031 Period 9.471 8.9838.530 8.111 7.722 7.360 6.710 6.145 5.6505216 4.833 4.494 4.192 10 Period 10.368 9.7879.253 8.7608.306 7.887 17.139 6495 5.938 5.453 5.029 4.656 4.327 11 Period 11.255 10.579 9.954 9.385 8.863 8.384 7.536 6.814 6.194 5.660 5.197 4.793 4.439 12 Period 12.134 11.348 10.635 9.9869.394 8.853 7.904 7103 6.424 5.842 5.342 4.910 4.533 13 Period 13.004 12.100 11.296 10.563 9.899 9.2958.244 7.3676.628 6.002 5.468 5.008 4.611 14 Period 13.885 12.849 11.938 11.11810.380 9.712 8.559 7.606 6.811 6.142 5.575 5.092 4.675 15 Period 18.046 16.351 14.87713.590 12.462 11.470 9.818 8.5147.489 6.623 5.929 5.353 4.870 20 Period 22.023 19.523 17 41315.622 14.094 12.78310 675 9.077 7.8436.873 6.097 5.467 4.948 25 Period 25 808 22.39 19.60017.292 15.372 1376511 2589.4278.055 7003 6.177 5.517 4.979 30 Period 32 83527356 23.11519.793 17.159 15.04 11.925 9.7798.244 7.105 6.233 5.548 4.997 40 14% 1.000 16% 1.000 18% 1.000 20% 1.000 2.140 2.160 2.180 2.200 Future Value of Annuity of $1 Periods 1% 2% 3% 4% 5% 6% 8% 10% 12% Period 1.000 1.000 1.000 1.000 1.000 1.000 1.000 1.000 1.000 1 Period 2.010 2020 2030 2040 2050 2.060 2.080 2.100 2.120 2 Period 3.030 3.0603.091 3.122 3.153 3.184 3.246 3.310 3.374 3 Period 4.060 4.122 4.184 4.246 4.310 4.375 4.506 4.641 4.779 4 Period 5.101 5.204 5.309 5.416 5,526 5,637 5,867 6.105 6.353 3.440 3.506 3.572 3.640 4.921 5.066 5.215 5.368 6.610 6.877 7.154 7.442 5 Period 6.152 6.308 6.468 6.633 6.802 6.975 7.336 7.716 8.115 8.536 8.977 9.442 9.930 Period 7.214 7.4347.6627.898 8.142 8.394 8.923 9.487 10.089 10.730 11.414 12.142 12.916 7 Period 8.286 8,583 8.8929.214 9.549 9.897 10.637 11.436 12.300 13.233 14.240 15.327 16.499 8 Period 9.369 9.755 10.15910,583 11.027 11.491 12.488 13.579 14.776 16.085 17.519 19.086 20.799 9 Period 10.46210.950 11.464 12.006 12.578 13.181 14.487 15.937 17.549 19.337 21.321 23.521 25.959 10 Period 11.567 12.16912.80813.486 14.207 14.972 16.645 18.531 20.655 23.045 25.733 28.755 32.150 11 Period 12.68313.412 1419215.026 15.917 16.870 18,977 21,384 24.133 27.271 30.850 34.931 39.581 12 Period 13.80914.680 15.61816.627 17.713 18.882 21.495 24.523 28.029 32.089 36.786 42.219 48.497 13 Period 14.94715.97417.08818.292 19,599 21.015 24 215 27.975 32 393 37.581 43.672 50.818 59.196 Period 16.00717.29318.599|20.024 21.579 23.276 27 152 31.772 37.280 43.842 51.660 60.965 72.035 15 Period 22.01924.297|26.87029.778 33.066 36.786 45.762 57 275 72.052 91.025 115,380 146.628 186.688 Period 28.24332.03036.45041.646 47.727 54.865 73.106 98.347 133.334 181.871 249.214 342.603471981 Period 34.78540.568 47.57556.085 66,439 70,058 113.283 164 494241.333 356.787 530.312790.948 1.181.882 Period 48.88660.40275.40195 020 120.800154.762259.057/442,593767.0911,342.0252,360.7574.163.2137, 343.858 14 20 25 30 40 Present Value of $1 Periods 1% 2% 3% 4% 5% 6% 8% 10% 12% 14% 16% 18% 20% Period 1 0.990 0.980 0.971 0.962 0.952 0.943 0.926 0.909 0.893 0.877 0.862 0.847 0.833 Period 2 0.980 0.961 0.943 0.925 0.907 0.890 0.8570.8260.797 0.769 0.743 0.7180.694 Period 3 0.971 0.942 0.915 0.889 0.864 0.840 0.794 0.751 0.712 0.675 0.641 0.609 0.579 Period 4 0.961 0.924 0.888 0.855 0.823 0.792 0.735 0.683 0.636 0.592 0.552 0.516 0.482 Period 5 0.951 0.906 0.863 0.822 0.784 0.747 0.681 0.621 0.567 0.5190.476 0.4370.402 Period 6 0.942 0.888 0.837 0.790 0.746 0.705 0.630 0.564 0.507 0.456 0.410 0.370 0.335 Period 7 0.933 0.871 0.813 0.760 0.711 0.665 0.583 0.513 0.452 0.400 0.354 0.314 0.279 Period 8 0.923 0.853 0.789 0.731 0.677 0.627 0.540 0.467 0.4040.3510.305 0.266 0.233 Period 9 0.914 0.837 0.766 0.703 0.645 0.592 0.500 0.424 0.361 0.308 0.263 0.225 0.194 Period 0.905 0.820 0.744 0.676 0.614 0.558 0.4630.386 0.322 0.270 0.227 0.191 0.162 10 Period 0.896 0.804 0.722 0.650 0.585 0.527 0.429 0.350 0.287 0.237 0.1950.162 0.135 11 Period 0.887 0.788 0.701 0.625 0.557 0.497 0.397 0.319 0.257 0.208 0.168 0.1370.112 12 Period 0.879 0.773 0.681 0.601 0.530 0.469 0.368 0.290 0.229 0.182 0.145 0.116 0.093 13 Period 0.870 0.758 0.661 0.577 0.505 0.442 0.340 0.263 0.205 0.160 0.125 0.099 0.078 14 Period 0.861 0.743 0.642 0.555 0.481 0.417 0.315 0.239 0.183 0.140 0.108 0.084 0.065 15 Period 0.820 0.673 0.554 0.456 0.377 0.312 0.215 0.149 0.1040.073 0.051 0.037 0.026 20 Period 0.780 0.610 0.478 0.375 0.295 0.233 0.146 0.092 0.0590.038 0.024 0.0160.010 25 Period 0.742 0.552 0.412 0.308 0.231 0.174 0.099 0.057 0.033 0.0200.012 0.007 0.004 30 Period 0.672 0.453 0.307 0.208 0.142 0.097 0.046 0.022 0.011 0.005 0.003 0.001 0.001 40 Future Value of $1 Periods 1% 2% 3% 4% 5% 6% 8% 10% 12% 14% 16% 18% Period 1 1.010 1.020 1.030 1.040 1.050 1.060 1.080 1.100 1.120 1.140 1.160 1.180 Period 2 1.020 1.040 1.061 1.0821.103 1.124 1.166 | 1.210 1.254 1.300 1.346 1.392 Period 3 1.030 1.061 1.093 1.125 1.158 1.191 1.260 1.331 1.405 1.482 1.561 1.643 Period 4 1.041 1.082 1.126 1.170 1.216 1.262 1.360 1.464 1.574 1.689 1.811 1.939 Period 5 1.051 1.104 1.159 1.217 1.276 1.338 1.469 1.611 1.762 1.925 2.100 2.288 Period 6 1.062 1.126 1.1941.265 1.340 1.419 1.587 1.772 1.974 2.195 2.436 2.700 Period 7 1.072 1.149 1.230 1.316 1.407 1.504 1.7141.949 2.211 2.502 2.826 3.185 Period 8 1.083 1.172 1.267 1.369 1.477 1.594 1.851 2.144 2.476 2.853 3.278 3.759 Period 9 1.094 1.195 1.305 1.423 1.551 1.689 1.999 2.358 2.773 3.252 3.803 4.435 Period 1.105 1.219 1.344 1.480 1.629 1.791 2.159 2.594 3.106 3.707 4.411 5.234 10 20% 1.200 1.440 1.728 2.074 2.488 2.986 3.583 4.300 5.160 6.192 1.116 1.243 1.384 1.539 1.710 1.898 2.332 2.853 3.479 4.226 5.117 6.176 7.430 8.916 Period 11 Period 12 Period 13 Period 14 Period 15 1.127 1.268 1.426 1.601 1.796 2.012 2.518 3.138 3.896 4.818 5.936 7.288 1.138 1.294 1.469 1.665 1.886 2.133 2.720 3.452 4.363 5.492 6.886 8.599 10.699 1.149 1.319 1.513 1.732 1.980 2.261 2.937 3.797 4.887 6.261 7.988 10.147 12.839 1.161 1.346 1.558 1.801 2.079 2.397 3.172 4.177 5.474 7.138 9.266 11.974 15.407 1.220 1.486 1.806 2.1912.653 3.207 4.6616.727 9.646 13.743 19.461 27.393 38.338 1.282 1.641 2.094 2.666 3.386 4.292 6.848 10.835 17.000 26.462 40.874 62.669 95.396 Period 20 Period 25 Period 30 Period 40 1.348 1.811 2.427 3.243 4.322 5.743 10.06317.449 29.960 50.950 85.850 143,371 237.376 1.489 2.208 3.262 4.801 7.040 10.286 21.725 45.259 93.051 188.884378.721750.3781,469.772 X X Requirements 1. What is the project's NPV? Is the investment attractive? Why or why not? 2. Assume the expansion has no residual value. What is the project's NPV? Is the investment still attractive? Why or why not? Cornier how Bear Valley, a popularski remort, could use capital budgeting to decide whether the 30 milion Book Pak Lodge expansion would be a good investment Click the icon to the won estimates) Click the icon to viw the promote annuity factor) Click the icon to view the present valon factor tab) (Click the icon to view the future value annuity factor table) Click the soon to view the future valid factor title Read the recurrents Requirement 1. What is the project's NPV? is the investment attractive? Why or why not? Calculate the net present value of the expansion (Round your answer to the nearest Whole dollar Use parents or a minus sign for a negative not presenta Net present value of expansion