

Answered step by step
Verified Expert Solution
Question
1 Approved Answer
Data Tables Step-by-Step Tutorial: Data Tables are used to see the effect of one or two variables on a formula. A Data Table allows you
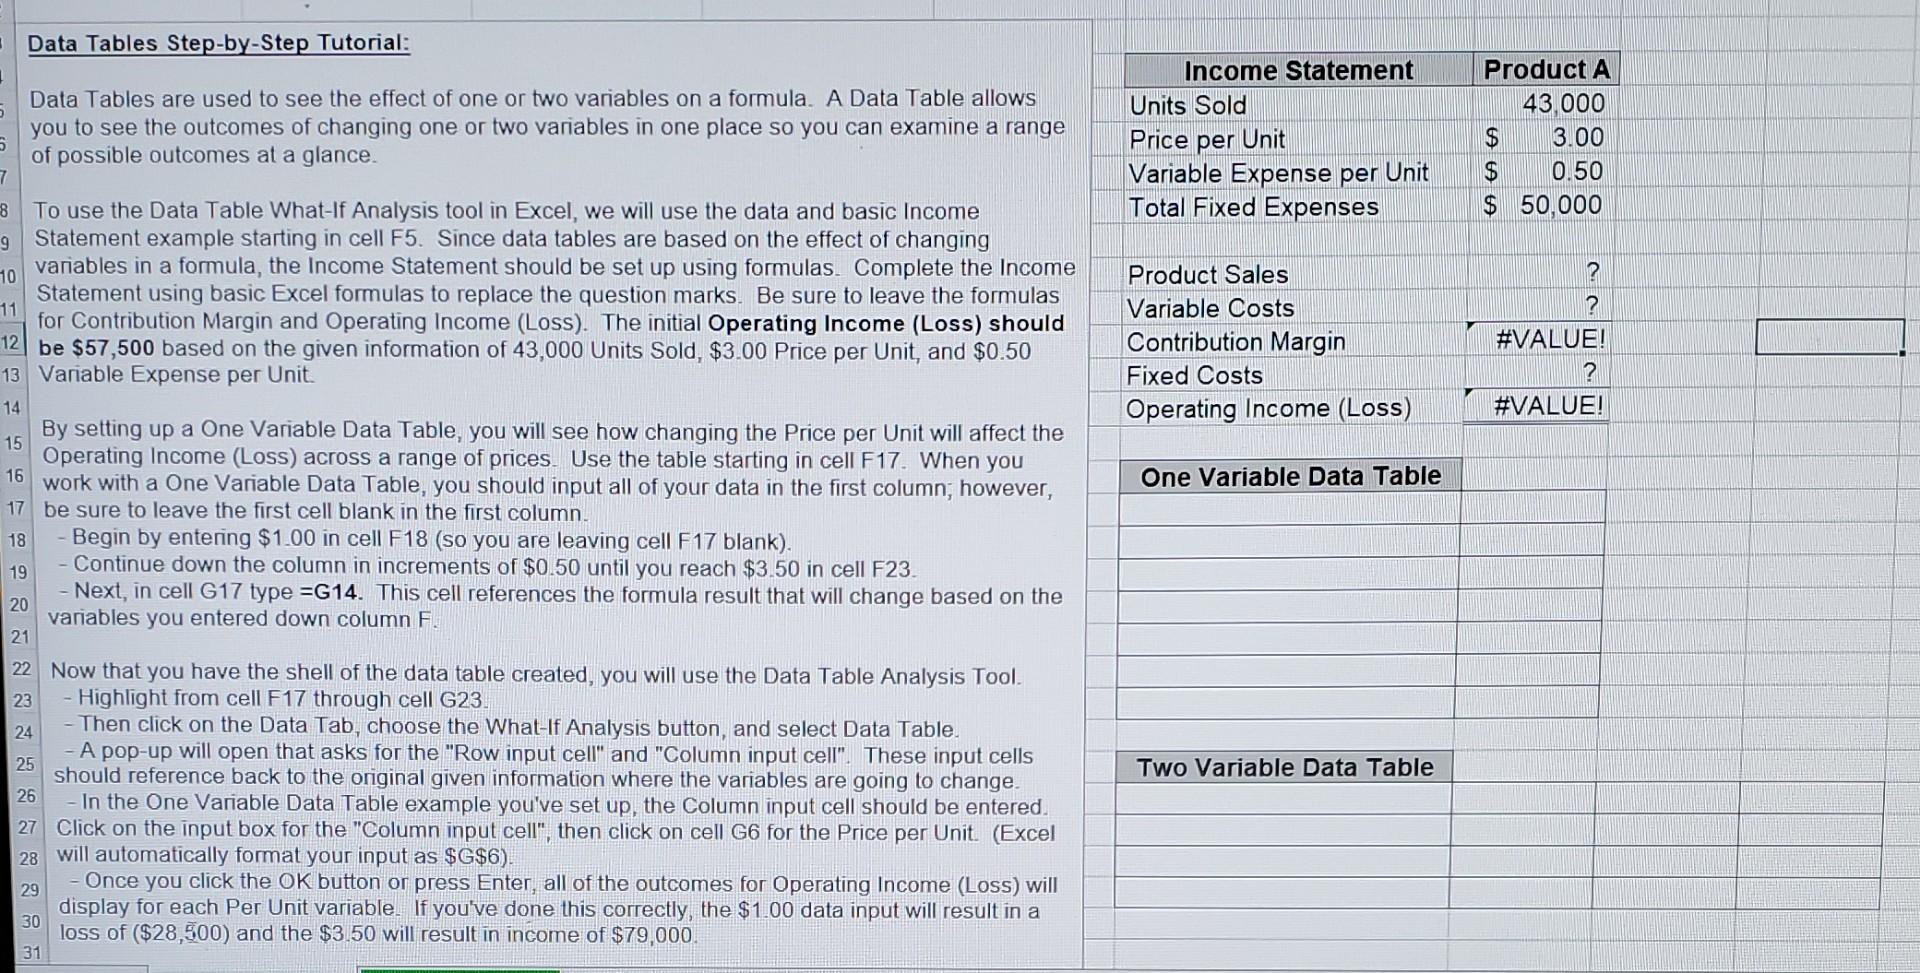
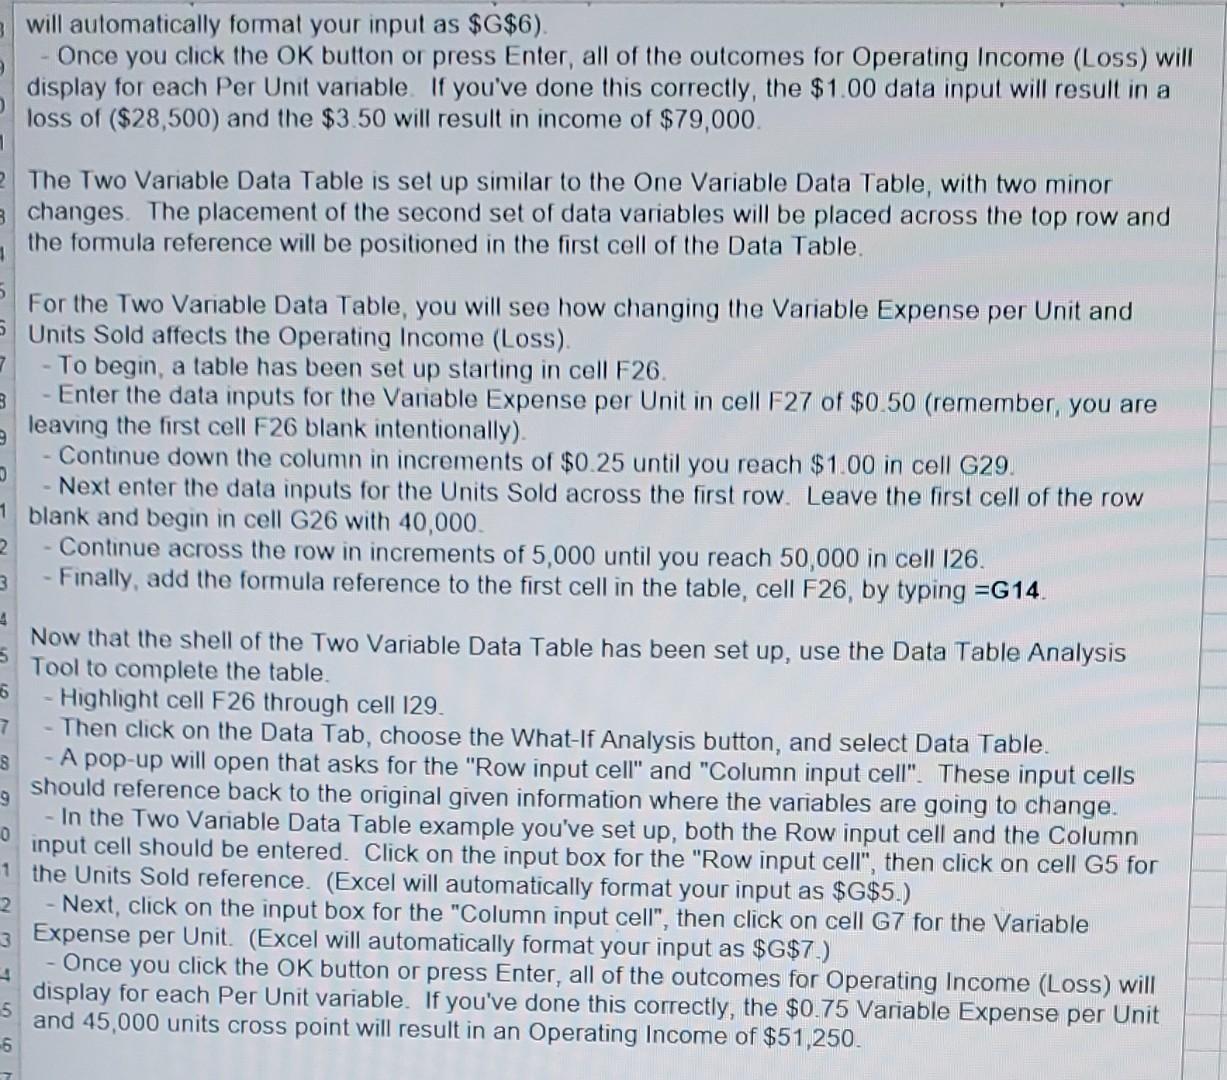
Data Tables Step-by-Step Tutorial: Data Tables are used to see the effect of one or two variables on a formula. A Data Table allows you to see the outcomes of changing one or two variables in one place so you can examine a range of possible outcomes at a glance. To use the Data Table What-If Analysis tool in Excel, we will use the data and basic Income Statement example starting in cell F5. Since data tables are based on the effect of changing variables in a formula, the Income Statement should be set up using formulas. Complete the Income Statement using basic Excel formulas to replace the question marks. Be sure to leave the formulas for Contribution Margin and Operating Income (Loss). The initial Operating Income (Loss) should be $57,500 based on the given information of 43,000 Units Sold, $3.00 Price per Unit, and $0.50 Variable Expense per Unit. By setting up a One Variable Data Table, you will see how changing the Price per Unit will affect the Operating Income (Loss) across a range of prices. Use the table starting in cell F17. When you work with a One Variable Data Table, you should input all of your data in the first column; however, be sure to leave the first cell blank in the first column. - Begin by entering $1.00 in cell F18 (so you are leaving cell F17 blank). - Continue down the column in increments of $0.50 until you reach $3.50 in cell F23. - Next, in cell G17 type =G14. This cell references the formula result that will change based on the variables you entered down column F. Now that you have the shell of the data table created, you will use the Data Table Analysis Tool. - Highlight from cell F17 through cell G23. - Then click on the Data Tab, choose the What-If Analysis button, and select Data Table. - A pop-up will open that asks for the "Row input cell" and "Column input cell". These input cells should reference back to the original given information where the variables are going to change. - In the One Variable Data Table example you've set up, the Column input cell should be entered. Click on the input box for the "Column input cell", then click on cell G6 for the Price per Unit. (Excel will automatically format your input as $G$6 ). - Once you click the OK button or press Enter, all of the outcomes for Operating Income (Loss) will display for each Per Unit variable. If you've done this correctly, the $1.00 data input will result in a loss of ($28,500) and the $3.50 will result in income of $79,000. will automatically formal your input as $G$6 ). Once you click the OK button or press Enter, all of the outcomes for Operating Income (Loss) will display for each Per Unit variable. If you've done this correctly, the $1.00 data input will result in a loss of ($28,500) and the $3.50 will result in income of $79,000. The Two Variable Data Table is set up similar to the One Variable Data Table, with two minor changes. The placement of the second set of data variables will be placed across the top row and the formula reference will be positioned in the first cell of the Data Table. For the Two Variable Data Table, you will see how changing the Variable Expense per Unit and Units Sold affects the Operating Income (Loss). - To begin, a table has been set up starting in cell F26. - Enter the data inputs for the Variable Expense per Unit in cell F27 of $0.50 (remember, you are leaving the first cell F26 blank intentionally). - Continue down the column in increments of $0.25 until you reach \$1.00 in cell G29. - Next enter the data inputs for the Units Sold across the first row. Leave the first cell of the row blank and begin in cell G26 with 40,000 . - Continue across the row in increments of 5,000 until you reach 50,000 in cell I26. - Finally, add the formula reference to the first cell in the table, cell F26, by typing =G14. Now that the shell of the Two Variable Data Table has been set up, use the Data Table Analysis Tool to complete the table. - Highlight cell F26 through cell I29. - Then click on the Data Tab, choose the What-If Analysis button, and select Data Table. - A pop-up will open that asks for the "Row input cell" and "Column input cell". These input cells should reference back to the original given information where the variables are going to change. - In the Two Variable Data Table example you've set up, both the Row input cell and the Column input cell should be entered. Click on the input box for the "Row input cell", then click on cell G5 for the Units Sold reference. (Excel will automatically format your input as $G$5.) - Next, click on the input box for the "Column input cell", then click on cell G7 for the Variable Expense per Unit. (Excel will automatically format your input as $G$7.) - Once you click the OK button or press Enter, all of the outcomes for Operating Income (Loss) will display for each Per Unit variable. If you've done this correctly, the $0.75 Variable Expense per Unit and 45,000 units cross point will result in an Operating Income of $51,250
Step by Step Solution
There are 3 Steps involved in it
Step: 1

Get Instant Access to Expert-Tailored Solutions
See step-by-step solutions with expert insights and AI powered tools for academic success
Step: 2

Step: 3
Ace Your Homework with AI
Get the answers you need in no time with our AI-driven, step-by-step assistance
Get Started
Audit And Business Performance
Authors: BELAMKADDAM HAMZA
1st Edition
6205444062, 978-6205444061