Answered step by step
Verified Expert Solution
Question
1 Approved Answer
Data Visualization and story telling - Tableau Hide Assignment Information Instructions About the data: University Advancement, Donations, and Giving. A table of donations made to
Data Visualization and story tellingTableau
Hide Assignment Information
Instructions
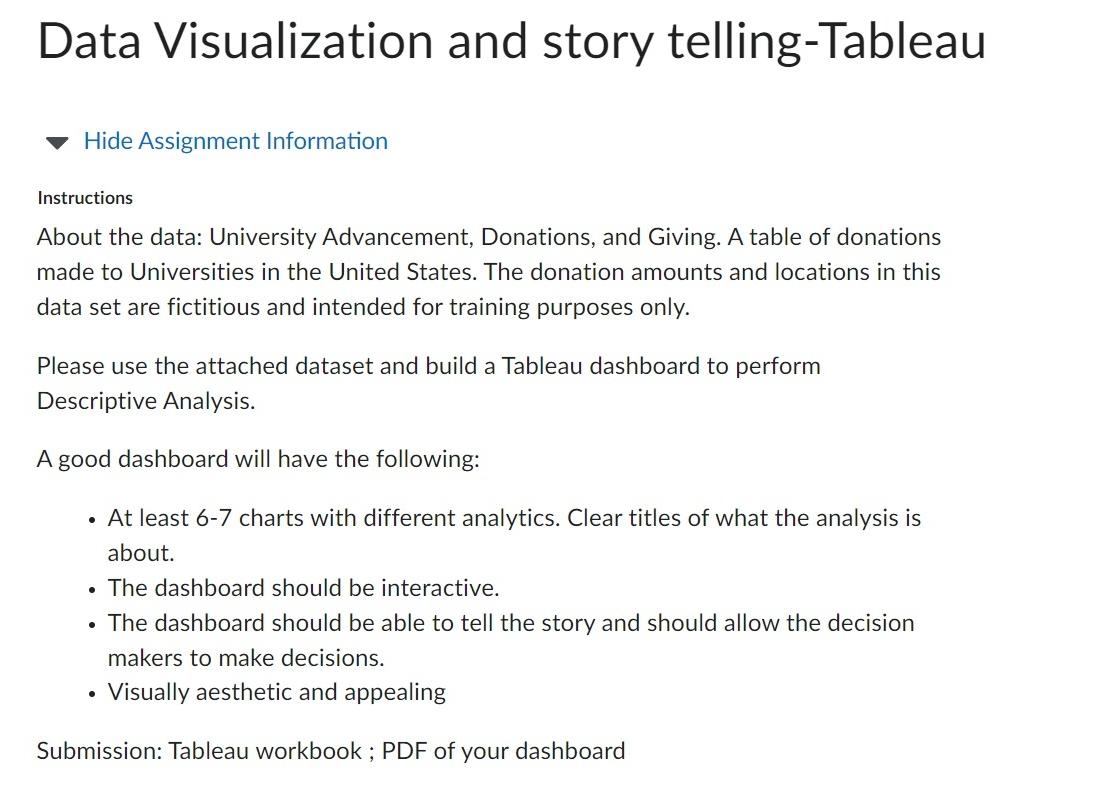
About the data: University Advancement, Donations, and Giving. A table of donations made to Universities in the United States. The donation amounts and locations in this data set are fictitious and intended for training purposes only.
Please use the attached dataset and build a Tableau dashboard to perform Descriptive Analysis.
A good dashboard will have the following:
At least charts with different analytics. Clear titles of what the analysis is about.
The dashboard should be interactive.
The dashboard should be able to tell the story and should allow the decision makers to make decisions.
Visually aesthetic and appealing
Submission: Tableau workbook ; PDF of your dashboard

Step by Step Solution
There are 3 Steps involved in it
Step: 1

Get Instant Access to Expert-Tailored Solutions
See step-by-step solutions with expert insights and AI powered tools for academic success
Step: 2

Step: 3

Ace Your Homework with AI
Get the answers you need in no time with our AI-driven, step-by-step assistance
Get Started


