Answered step by step
Verified Expert Solution
Question
1 Approved Answer
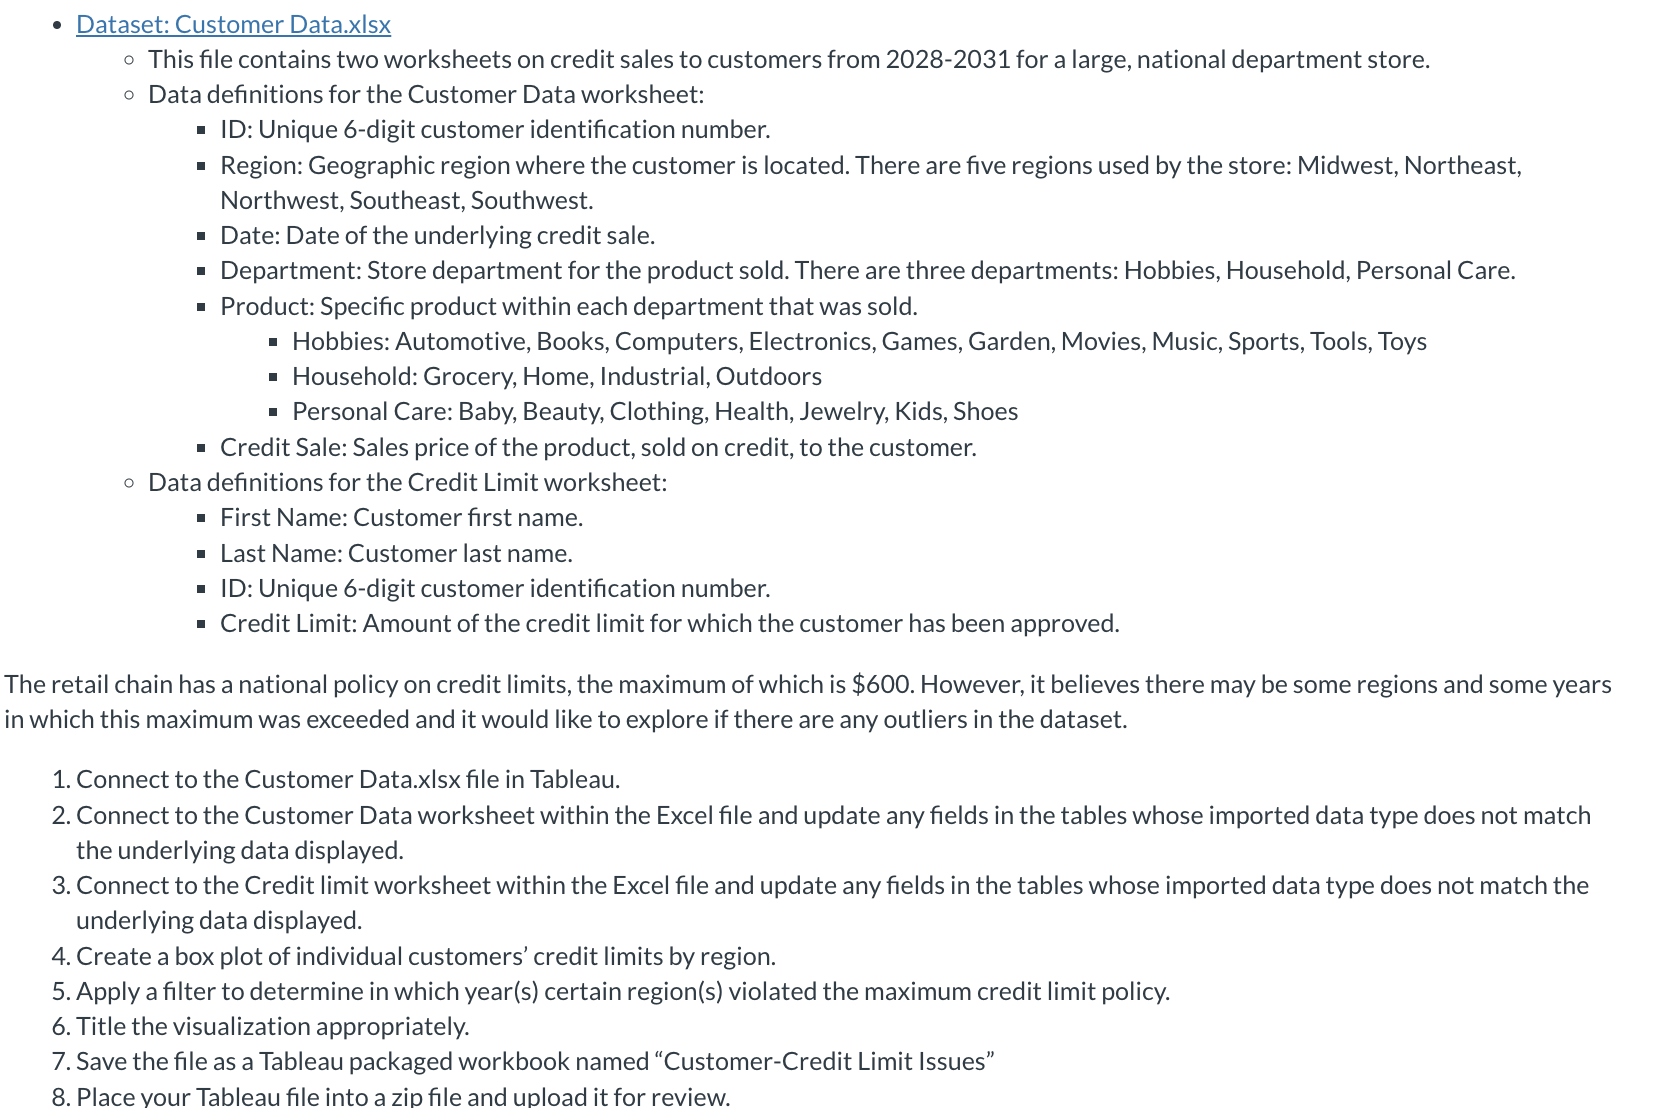
Dataset: Customer Data.xlsx This file contains two worksheets on credit sales to customers from 2 0 2 8 - 2 0 3 1 for a
Dataset: Customer Data.xlsx
This file contains two worksheets on credit sales to customers from for a large, national department store.
Data definitions for the Customer Data worksheet:
ID: Unique digit customer identification number.
Region: Geographic region where the customer is located. There are five regions used by the store: Midwest, Northeast,
Northwest, Southeast, Southwest.
Date: Date of the underlying credit sale.
Department: Store department for the product sold. There are three departments: Hobbies, Household, Personal Care.
Product: Specific product within each department that was sold.
Hobbies: Automotive, Books, Computers, Electronics, Games, Garden, Movies, Music, Sports, Tools, Toys
Household: Grocery, Home, Industrial, Outdoors
Personal Care: Baby, Beauty, Clothing, Health, Jewelry, Kids, Shoes
Credit Sale: Sales price of the product, sold on credit, to the customer.
Data definitions for the Credit Limit worksheet:
First Name: Customer first name.
Last Name: Customer last name.
ID: Unique digit customer identification number.
Credit Limit: Amount of the credit limit for which the customer has been approved.
The retail chain has a national policy on credit limits the maximum of which is $ However, it believes there may be some regions and some years
in which this maximum was exceeded and it would like to explore if there are any outliers in the dataset.
Connect to the Customer Data.xlsx file in Tableau.
Connect to the Customer Data worksheet within the Excel file and update any fields in the tables whose imported data type does not match
the underlying data displayed.
Connect to the Credit limit worksheet within the Excel file and update any fields in the tables whose imported data type does not match the
underlying data displayed.
Create a box plot of individual customers' credit limits by region.
Apply a filter to determine in which years certain regions violated the maximum credit limit policy.
Title the visualization appropriately.
Save the file as a Tableau packaged workbook named "CustomerCredit Limit Issues"
Place your Tableau file into a zip file and upload it for review.

Step by Step Solution
There are 3 Steps involved in it
Step: 1

Get Instant Access to Expert-Tailored Solutions
See step-by-step solutions with expert insights and AI powered tools for academic success
Step: 2

Step: 3

Ace Your Homework with AI
Get the answers you need in no time with our AI-driven, step-by-step assistance
Get Started


